Monthly Archives: October 2016

Home Prices to Increase 7.25% in Tampa Predicts Pricing Nation

BOSTON, MA / ACCESSWIRE / October 28, 2016 / Pricing Nation forecasts that the average home value in the Tampa Metropolitan Statistical Area (MSA) will increase by 7.25 percent over the next twelve months. The greatest projected increase, 16.97%, is in the Clearwater zip code of 33767. The greatest projected decline, -7.15%, is in the Riverview zip code of 33578. Pricing Nation also provides projections for the Tampa MSA of future home prices at the zip code level and the individual house level at www.pricingnation.com. We believe this more micro based, ground up approach will add value to the home price forecasting space. We intend to publish our Tampa forecast on a quarterly basis.

A table with the top 5 biggest increases and decreases per zip code can be found below. The Pricing Nation Econometrics Heat Map (also below) visualizes how the average home prices will vary across zip codes in the Tampa MSA.

Pricing Nation offers free “Home Investment Report Cards” including local demand/supply factors and grades for each home in the current MSAs at www.pricingnation.com. For a limited time PricingNation.com is offering its home level forecast for the next twelve months. “The Home Investment Report” card is designed to be easy to use for all home buyers and sellers.

Pricing Nation is currently providing projections for homes in the Boston, Seattle, Miami, Tampa MSAs and NYC and is expanding its offerings to other cities in the near future.

For more information about our forecasts, please contact Raj Koganti at raj@pricingnation.com.

* Downturn data reported by S&P/Case-Shiller Home Price Indices, and recession data reported by the National Bureau of Economic Research (NBER)

SOURCE: Pricing Nation

ReleaseID: 447857

Post Earnings Coverage as Danaher Q3 Earnings Shine on Acquisition

LONDON, UK / ACCESSWIRE / October 28, 2016 / Active Wall St. announces its post-earnings coverage on Danaher Corp. (NYSE: DHR). The company reported its financial results for the third quarter fiscal 2016 (Q3 FY16) on October 20, 2016. The Washington, DC-based company reported a 17.5% and 22.5% y-o-y growth in its sales and adjusted net earnings per share, respectively. Register with us now for your free membership at: http://www.activewallst.com/register/.

Today, AWS is promoting its earnings coverage on DHR; touching on Cepheid (NASDAQ: CPHD). Get our free coverage by signing up to:

http://www.activewallst.com/registration-3/?symbol=DHR

http://www.activewallst.com/registration-3/?symbol=CPHD

Earnings Reviewed

In Q3 FY16, Danaher reported sales of $4.13 billion, up from $3.51 billion recorded at the end of Q3 FY15. However, sales numbers for the reported quarter came in marginally short of market expectations of $4.15 billion. Furthermore, the company’s core revenue improved 3% y-o-y in Q3 FY16. The company stated that its core sales growth was consistent across segments, as each of them achieved at least 3% core revenue growth in the quarter.

The global science and technology innovator reported Q3 FY16 GAAP net income of $402.6 million, or $0.57 per diluted share, compared to $379.9 million, or $0.54 per diluted share, in Q3 FY15. Furthermore, the company’s non-GAAP net income for Q3 FY16 came in at $0.87 per diluted share compared to $0.71 per diluted share in Q3 FY15. Market analysts had forecasted non-GAAP diluted earnings of $0.83 per share for Q3 FY16.

Operating Metrics

For the three months ended on October 01, 2016, the computer chip maker reported gross margin of $2.29 billion, or 55.3% of sales, compared to $1.89 billion, or 53.9% of sales, in the prior year’s quarter. The company’s operating margin for Q3 FY16 came in at $699.1 million, or 16.9% of sales, versus $480.0 million, or 13.7% of sales, in Q3 FY15. The company’s strong margin expansion drove the double-digit adjusted net earnings growth in the quarter.

Segment Performance

During Q3 FY16, the company’s Life Sciences segment’s sales surged 64.5% y-o-y to $1.33 billion. The segment core revenues improved 3% y-o-y during the quarter, while acquisition contributed 61.0% to sales growth. The segment reported operating income of $204.7 million, or 15.4% of segment revenues, for Q3 FY16 compared to $51.5 billion, or 6.4% of segment sales, in Q3 FY15.

Danaher’s Diagnostics segment generated sales of $1.21 billion, which was 3% more than the last year’s recorded sales numbers of $1.18 billion. The segment’s operating income improved to $193.9 million, 16.0% of segment revenues in Q3 FY16 from $159.2 million, 13.5% of segment revenues, in Q3 FY15.
The company’s Dental sales for Q3 FY16 were up 3.5% y-o-y to $675.6 million. Furthermore, operating margin for the reported quarter came in at $101.3 million, or 15.0% of segment sales, versus $96.8 million, or 14.8% of segment sales, in Q3 FY15.

Environmental & Applied Solutions segment reported sales of $918.4 million in Q3 FY16, up by 4.5% on y-o-y basis. The segment had an operating income of $223.4 million, or 24.3% segment sales, in Q3 FY16 compared to $215.6 million, or 24.5% of segment sales, in the last year’s quarter.

Cash Matters

For the three months ended on September 30, 2016, Danaher generated $850 million in cash from operations compared to $669 million in the prior year’s quarter. The company reported free cash flow of $701 million in Q3 FY16 compared to $518 million in the last year’s comparable quarter. Furthermore, the company had cash and cash equivalents balance of $971.4 million, as on September 30, 2016 compared to $790.8 million, at the close of books on December 31, 2015.

Acquisition Spree

On September 06, 2016, Danaher announced that it had entered into a definitive merger agreement with Cepheid and will acquire all of the outstanding shares of Cepheid for $53.00 per share in cash, costing approximately $4 billion including net debt and cash. Furthermore, Danaher also announced its interest in acquiring Phenomenex Inc. on October 12, 2016. Both the acquisitions are expected to close by end of 2016, subject to customary closing conditions and regulatory approvals.

Earlier in August 2015, the company had completed the acquisition of Pall Corp. for $13.8 billion, resulting in a significant improvement of its Q3 FY16 results.

Outlook

For Q4 FY16, Danaher expects diluted net earnings to be in the range of $2.86 per share to $2.90 per share along with non-GAAP diluted net earnings in the range of $1.01 per share to $1.05 per share.

The company’s management also forecasts diluted net earnings for full year FY16 to lie between $2.86 per share and $2.90 per share with non-GAAP diluted net earnings in the range of $3.57 per share to $3.61 per share.

Stock Performance

Danaher’s share price finished yesterday’s trading session at $78.33, marginally advancing 0.76%. A total volume of 4.2 million shares exchanged hands, which was higher than the 3 months average volume of 2.88 million shares. The stock has advanced 7.13% and 12.29% in the last six months and past twelve months, respectively. Furthermore, since the start of the year, shares of the company have gained 11.79%. The stock is trading at a PE ratio of 19.95 and has a dividend yield of 0.64%.

Active Wall Street:

Active Wall Street (AWS) produces regular sponsored and non-sponsored reports, articles, stock market blogs, and popular investment newsletters covering equities listed on NYSE and NASDAQ and micro-cap stocks. AWS has two distinct and independent departments. One department produces non-sponsored analyst certified content generally in the form of press releases, articles and reports covering equities listed on NYSE and NASDAQ and the other produces sponsored content (in most cases not reviewed by a registered analyst), which typically consists of compensated investment newsletters, articles and reports covering listed stocks and micro-caps. Such sponsored content is outside the scope of procedures detailed below.

AWS has not been compensated; directly or indirectly; for producing or publishing this document.

PRESS RELEASE PROCEDURES:

The non-sponsored content contained herein has been prepared by a writer (the “Author”) and is fact checked and reviewed by a third party research service company (the “Reviewer”) represented by a credentialed financial analyst, for further information on analyst credentials, please email info@activewallst.com. Rohit Tuli, a CFA® charterholder (the “Sponsor”), provides necessary guidance in preparing the document templates. The Reviewer has reviewed and revised the content, as necessary, based on publicly available information which is believed to be reliable. Content is researched, written and reviewed on a reasonable-effort basis. The Reviewer has not performed any independent investigations or forensic audits to validate the information herein. The Reviewer has only independently reviewed the information provided by the Author according to the procedures outlined by AWS. AWS is not entitled to veto or interfere in the application of such procedures by the third-party research service company to the articles, documents or reports, as the case may be. Unless otherwise noted, any content outside of this document has no association with the Author or the Reviewer in any way.

NO WARRANTY

AWS, the Author, and the Reviewer are not responsible for any error which may be occasioned at the time of printing of this document or any error, mistake or shortcoming. No liability is accepted whatsoever for any direct, indirect or consequential loss arising from the use of this document. AWS, the Author, and the Reviewer expressly disclaim any fiduciary responsibility or liability for any consequences, financial or otherwise arising from any reliance placed on the information in this document. Additionally, AWS, the Author, and the Reviewer do not (1) guarantee the accuracy, timeliness, completeness or correct sequencing of the information, or (2) warrant any results from use of the information. The included information is subject to change without notice.

NOT AN OFFERING

This document is not intended as an offering, recommendation, or a solicitation of an offer to buy or sell the securities mentioned or discussed, and is to be used for informational purposes only. Please read all associated disclosures and disclaimers in full before investing. Neither AWS nor any party affiliated with us is a registered investment adviser or broker-dealer with any agency or in any jurisdiction whatsoever. To download our report(s), read our disclosures, or for more information, visit http://www.activewallst.com/disclaimer/.

CONTACT

For any questions, inquiries, or comments reach out to us directly. If you’re a company we are covering and wish to no longer feature on our coverage list contact us via email and/or phone between 09:30 EDT to 16:00 EDT from Monday to Friday at:

Email: info@activewallst.com
Phone number: 1-858-257-3144

Office Address: 3rd floor, 207 Regent Street, London, W1B 3HH, United Kingdom

CFA® and Chartered Financial Analyst® are registered trademarks owned by CFA Institute.

SOURCE: Active Wall Street

ReleaseID: 447874

SHAREHOLDER ALERT: Purcell Julie & Lefkowitz LLP Is Investigating Drew Industries Incorporated for Potential Breaches Of Fiduciary Duty By Its Board of Directors

NEW YORK, NY / ACCESSWIRE / October 28, 2016 / Purcell Julie & Lefkowitz LLP, a class action law firm dedicated to representing shareholders nationwide, is investigating a potential breach of fiduciary duty claim involving the board of directors of Drew Industries Incorporated (NYSE: DW).

If you are a shareholder of Drew Industries and are interested in obtaining additional information regarding this investigation, free of charge, please visit us at:

http://pjlfirm.com/drew-industries-incorporated/

You may also contact Robert H. Lefkowitz, Esq. either via email at rl@pjlfirm.com or by telephone at 212-725-1000. One of our attorneys will personally speak with you about the case at no cost or obligation.

Purcell Julie & Lefkowitz LLP is a law firm exclusively committed to representing shareholders nationwide who are victims of securities fraud, breaches of fiduciary duty and other types of corporate misconduct. For more information about the firm and its attorneys, please visit http://pjlfirm.com. Attorney advertising. Prior results do not guarantee a similar outcome.

SOURCE: Purcell Julie & Lefkowitz LLP

ReleaseID: 447885

Austral Gold Commissions a Pre-Feasibility Study for Combined Amancaya and Guanaco Operations

VANCOUVER, BC / ACCESSWIRE / October 28, 2016 / Austral Gold Limited. (ASX: AGD) (TSXV: AAM) (“Austral” or the “Company”) is pleased to announce it has commissioned Roscoe Postle Associates Inc (“RPA”) to undertake a Pre-Feasibility Study (“PFS”) to evaluate the viability of Austral’s plan to build and operate the Amancaya Project in conjunction with its operation of the nearby Guanaco underground mine and agitation leach plant. The Company expects the report to be completed by the first quarter of 2017.

“We are pleased to announce the engagement of RPA to undertake this PFS, which will contemplate the combined operation of our high grade gold-silver Amancaya Project with our Guanaco mine in Chile,” stated Stabro Kasaneva, CEO of Austral Gold. “Infill drilling commenced in the first week in September with the goal to provide data for this study. In parallel, we are expecting to continue to advance other elements of the project that would put us in the position to ramp up quickly to commencing operations at Amancaya if the results of the PFS are favourable.”

The Amancaya Project is 60 kilometres to the southwest of Austral’s underground gold mine at Guanaco. If the PFS is favourable, Austral expects to haul production from initial small open pits on two veins at Amancaya to the Guanaco plant for processing, which is approximately 73 kilometres from the proposed mine via public roads. In parallel, Austral plans to develop underground infrastructure and access to enable production from the steeply dipping veins that host the gold and silver mineralisation.

Qualified Person

Mike Brown, MAIG, as a qualified person under NI 43-101 and an employee of the Company, has reviewed and prepared all technical information.

About Austral Gold

Austral Gold Limited is a growing precious metals mining, development and exploration company building a portfolio of quality assets in Chile and Argentina. The Company’s flagship Guanaco project in Chile is a low-cost gold and silver producing mine with further exploration upside. The company is also operator of the underground silver-gold Casposo mine in San Juan, Argentina. With an experienced local technical team and highly regarded major shareholder, Austral’s goal is to continue to strengthen its asset base through acquisition and discovery. Austral Gold Limited is listed on the TSX Venture Exchange (TSXV: AAM) and the Australian Securities Exchange (ASX: AGD). For more information, please consult the company’s website www.australgold.com.

Neither TSX Venture Exchange nor its Regulation Services Provider (as that term is defined in the policies of the TSX Venture Exchange) accepts responsibility for the adequacy or accuracy of this release.

On behalf of Austral Gold Limited:

“Stabro Kasaneva”
President and CEO

Further information please contact:

Alison Crealy
info@australgold.com.au
+61 (2) 9380 7233

Mike Brown
mbrown@australgold.com.au
+1 604 568 2496 ext 21

Forward Looking Statements

Statements in this news release that are not historical facts are forward-looking statements. Forward-looking statements are statements that are not historical, and consist primarily of projections – statements regarding future plans, expectations and developments. Words such as “expects”, “intends”, “plans”, “may”, “could”, “potential”, “should”, “anticipates”, “likely”, “believes” and words of similar import tend to identify forward-looking statements. Forward-looking statements in this news release include Austral’s expectation that the PFS will be completed by the first quarter of 2017, that the infill drilling is expected to upgrade the category of the existing resource and its expectation that, if the results of the PFS are favourable, it can continue to advance other elements of the Amancaya project that would put it in a position to ramp up quickly to commencing operations at Amancaya, haul production from initial small open pits and develop underground infrastructure and access at Amancaya. All of these forward-looking statements are subject to a variety of known and unknown risks, uncertainties and other factors that could cause actual events or results to differ from those expressed or implied, including, without limitation, business integration risks; uncertainty of production, development plans and cost estimates, commodity price fluctuations; political or economic instability and regulatory changes; currency fluctuations, the state of the capital markets, uncertainty in the measurement of mineral reserves and resource estimates, Austral’s ability to attract and retain qualified personnel and management, potential labour unrest, reclamation and closure requirements for mineral properties; unpredictable risks and hazards related to the development and operation of a mine or mineral property that are beyond the Company’s control, the availability of capital to fund all of the Company’s projects and other risks and uncertainties identified under the heading “Risk Factors” in the Company’s continuous disclosure documents filed on SEDAR. You are cautioned that the foregoing list is not exhaustive of all factors and assumptions which may have been used. Austral cannot assure you that actual events, performance or results will be consistent with these forward-looking statements, and management’s assumptions may prove to be incorrect. Austral’s forward-looking statements reflect current expectations regarding future events and operating performance and speak only as of the date hereof and Austral does not assume any obligation to update forward-looking statements if circumstances or management’s beliefs, expectations or opinions should change other than as required by applicable law. For the reasons set forth above, you should not place undue reliance on forward-looking statements.

SOURCE: Austral Gold Limited

ReleaseID: 447886

Shrink Sleeve & Stretch Sleeve Labels Market worth 13.20 Billion USD by 2020

Increasing demand for sustainable polymer films, 3600 display, and tamper-evident also drive the growth of the stretch sleeve & shrink sleeve labels market. The tangled recycling process is the most challenging concern in the market.

Seattle, United States – October 28, 2016 /MarketersMedia/ —

The report “Shrink Sleeve & Stretch Sleeve Labels Market by Polymer Film (PVC, PETG, OPS, PE and Others), by Type (Shrink and Stretch), by Ink & Printing Technology, by Application (Food, Beverages, Personal Care and Others), by Region – Global Forecast to 2020”, defines and segments the global stretch & shrink sleeve labels market with analysis and forecasting of the global volumes and values for the stretch & shrink sleeve labels market. It also identifies the driving and restraining factors of the market with an analysis of trends, opportunities, burning issues, winning imperatives, and challenges.

Browse 88 market data tables and 53 figures spread through 158 pages and in-depth TOC on “Shrink Sleeve & Stretch Sleeve Labels Market – Global Forecast to 2020”

Download Free PDF Brochure: http://www.marketsandmarkets.com/pdfdownload.asp?id=26633552

The market is segmented on the basis of volumes and values, into major regions, such as North America, Europe, Asia-Pacific, and Rest of the World (RoW). The key countries are covered and their market sizes have been forecasted for each region. Further, the market is segmented in terms of volumes and values, on the basis of type, raw material, and application.

The stretch & shrink sleeve labels market is buyer-oriented. It has shown substantial growth due to the rising urbanized population, resurgence of the packaging and labeling industry in developing economies, increasing demand for packaged food, and emphasis on the usage of sustainable materials. The keys aspects such as tamper-evident & anti-counterfeiting facility, 360° display, and extra printing space have fostered the market.

The U.S., China, Japan, Germany, Brazil, Argentina, Canada, India, and South Africa are investing large amounts in the labeling and packaging industry; hence, it is important to achieve rapid and sustained economic growth. Major players in the market are developing new techniques to achieve sustainability.

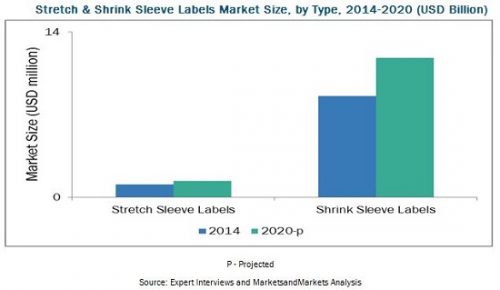
The global stretch & shrink sleeve labels market is projected to reach USD 13.20 Billion by 2020, at a CAGR of 5.5% from 2015 to 2020. The Asia-Pacific region dominated the market followed by Europe and North America in 2014. Developing countries such as China and India are estimated to grow at a higher rate from 2015 to 2020.

The most severe challenge that the stretch & shrink sleeve labels market faces is the recycling of the labels. The stretch & shrink sleeve labels market is growing at a steady pace; however, it is also creating extensive waste. The issue becomes more critical as the recycling process is highly complex and requires large amount of capital.

The global stretch & shrink sleeve labels market is marked with intense competition due to the presence of a large number of both, big and small firms. New product launches and innovations are the key strategies adopted by market players to ensure their growth in the market. The key players include Berry Plastics Group Inc. (U.S.), CCL Industries (Canada), Cenveo, Inc. (U.S.), Huhtamaki OYJ (Finland), Klockner Pentaplast Group (Germany), The Dow Chemical Company (U.S.), Fuji Seal International Inc. (Japan), Hammer Packaging (U.S.), Macfarlane Group (U.K.), and Sleeveco (U.S.).

Free Sample Pages: http://www.marketsandmarkets.com/requestsample.asp?id=26633552

This report estimates the market size of the global shrink sleeve & stretch sleeve labels market in terms of value (USD million) and volume (million m2). In this report, the market is broadly segmented based on type, polymer film, application, printing technology, ink, and region. Market drivers, restraints, challenges, material, and product price trends are discussed in detail. Market share, by all the major players, is discussed in detail for the overall market. The shrink sleeve & stretch sleeve labels market has grown significantly in the last few years and this trend is expected to continue.

Speak to Analyst (Ask for Customized Report Matching Your Exact Requirement): http://www.marketsandmarkets.com/speaktoanalyst.asp?id=26633552

About MarketsandMarkets

MarketsandMarkets is the largest market research firm worldwide in terms of annually published premium market research reports. Serving 1700 global fortune enterprises with more than 1200 premium studies in a year, M&M is catering to a multitude of clients across 8 different industrial verticals. We specialize in consulting assignments and business research across high growth markets, cutting edge technologies and newer applications. Our 850 fulltime analyst and SMEs at MarketsandMarkets are tracking global high growth markets following the “Growth Engagement Model – GEM”. The GEM aims at proactive collaboration with the clients to identify new opportunities, identify most important customers, write “Attack, avoid and defend” strategies, identify sources of incremental revenues for both the company and its competitors.

M&M’s flagship competitive intelligence and market research platform, “RT” connects over 200,000 markets and entire value chains for deeper understanding of the unmet insights along with market sizing and forecasts of niche markets. The new included chapters on Methodology and Benchmarking presented with high quality analytical infographics in our reports gives complete visibility of how the numbers have been arrived and defend the accuracy of the numbers.

We at MarketsandMarkets are inspired to help our clients grow by providing apt business insight with our huge market intelligence repository.

For more information, please visit http://www.marketsandmarkets.com/Market-Reports/shrink-stretch-sleeve-labels-market-26633552.html

Contact Info:
Name: Rohan
Organization: MarketsandMarkets

Source: http://marketersmedia.com/shrink-sleeve-stretch-sleeve-labels-market-worth-13-20-billion-usd-by-2020/141917

Release ID: 141917

Switchgear Market worth 144.41 Billion USD by 2021

The top players in the switchgear market include ABB Ltd. (Switzerland), TE Connectivity (Switzerland), Mitsubishi Electric Corporation (Japan), Siemens AG (Germany), Alstom (France), General Electric Company (U.S.), Crompton Greaves Ltd. (India), and Eaton Corporation (Ireland).

Seattle, United States – October 28, 2016 /MarketersMedia/ —

The report “Switchgear Market by Voltage (52 kV), by End-user (Transmission & Distribution Utilities, Manufacturing & Process Industries, and Commercial & Residential Infrastructure), and by Region – Global Trends & Forecast to 2021”, The switchgear market is expected to grow from an estimated USD 89.40 Billion in 2016 to USD 144.41 Billion by 2021, at a CAGR of 10.07% from 2016 to 2021. Increasing investments in transmission & distribution network development and growing need for efficient & reliable power are driving the global switchgear market.

Browse 73 market data Tables and 51 Figures spread through 159 Pages and in-depth TOC on “Switchgear Market “

Download Free PDF Brochure: http://www.marketsandmarkets.com/pdfdownload.asp?id=1162268

Increasing preference for low voltage switchgear of capacity <1 kV

The <1 kV switchgears are used to control power supply and protect low voltage equipment in an electrical circuit. These switchgears are extensively used in commercial, residential, and industrial applications for various purposes; therefore, the demand for low voltage switchgears is in-line with industrial and urban developments, globally.

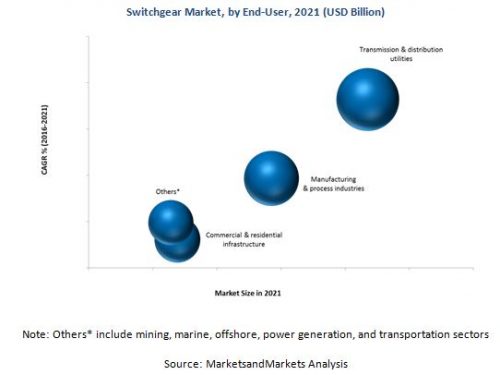
Transmission & distribution utilities is the largest end-user segment

Switchgears reduce the risk of losing costly instruments and equipment, due to current and voltage fluctuations in the power network systems. They are used for switching the power supply given to the equipment or the circuit during the event of a fault. With increasing electricity access worldwide, the number of substations would increase, which in turn would raise the demand for switchgears.

Asia-Pacific is the dominant market for switchgears

In this report, the switchgear market has been analyzed with respect to five regions, namely, North America, Europe, Asia-Pacific, South America, and the Middle East & Africa. The Asia-Pacific region holds the largest market for switchgear, driven largely by the number of transmission & distribution line upgrades and developments in China, India, and the ASEAN countries. The region would continue to dominate the market during the forecast period, due to strong smart grid initiatives, high investments in transmission & distribution infrastructure upgrade, energy efficiency measures, and renewable projects.

The switchgear industry is fragmented and offers several opportunities for consolidation and growth in efficiency through an increase in economies of scale. The industry has low entry and exit barriers. The top players in the switchgear market include ABB Ltd. (Switzerland), TE Connectivity (Switzerland), Mitsubishi Electric Corporation (Japan), Siemens AG (Germany), Alstom (France), General Electric Company (U.S.), Crompton Greaves Ltd. (India), and Eaton Corporation (Ireland).

Dominant players are trying to penetrate developing economies and adopting various methods to grab the market share. The scope of the report aids market participants to identify high growth markets and help managing key investment decisions.

The report segments the market on the basis of voltage range –52 kV; end-user – transmission & distribution utilities, manufacturing & process industries, commercial & residential infrastructure, and others (mining, marine, offshore power generation, and transportation); and region – Asia-Pacific, Europe, North America, South America, and the Middle East & Africa. Each region has been further studied on the basis of its important country markets.

Free Sample Pages: http://www.marketsandmarkets.com/requestsample.asp?id=1162268

The original equipment manufacturers of switchgear include ABB Ltd. (Switzerland), Eaton Corporation (Ireland), GE (U.S.), Schneider Electric SE (France), and Mitsubishi Electric Corporation (Japan) among others. The end-users include United States National Grid (USNG) (U.S.), State Grid Corporation of China (SGCC) (China), Power Grid Corporation of India Ltd. (PGCIL) (India), Brazilian Electricity Regulatory Agency (ANEEL) (Brazil), and Tenaga Nasional Berhad (TNB) (Malaysia) among others.

Target Audience:

Switchgear manufacturers, dealers, and suppliers
Transmission and distribution utilities
State and national regulatory authorities
Power generation plants
Consulting companies and associations in the energy and power sector
Government and research organizations

“Study answers several questions for the stakeholders, primarily which market segments to focus on in the next 2–5 years for prioritizing the efforts and investments”.

Available Customizations:

With the given market data, MarketsandMarkets offers customizations as per the client’s specific needs. The following customization options are available for the report:

Product Analysis

Product Matrix which gives a detailed comparison of the product portfolio of each company

Regional Analysis

Further breakdown of the Rest of Asia-Pacific switchgear market into South Korea, Malaysia, and Indonesia among others
Further breakdown of the Middle East & Africa switchgear market into Iran, Iraq, Qatar, Nigeria, and Algeria among others

Company Information

Detailed analysis and profiling of additional market players (Up to 5)

Speak to Analyst: http://www.marketsandmarkets.com/speaktoanalyst.asp?id=1162268

About MarketsandMarkets

MarketsandMarkets is the largest market research firm worldwide in terms of annually published premium market research reports. Serving 1700 global fortune enterprises with more than 1200 premium studies in a year, M&M is catering to a multitude of clients across 8 different industrial verticals. We specialize in consulting assignments and business research across high growth markets, cutting edge technologies and newer applications. Our 850 fulltime analyst and SMEs at MarketsandMarkets are tracking global high growth markets following the “Growth Engagement Model – GEM”. The GEM aims at proactive collaboration with the clients to identify new opportunities, identify most important customers, write “Attack, avoid and defend” strategies, identify sources of incremental revenues for both the company and its competitors.

M&M’s flagship competitive intelligence and market research platform, “RT” connects over 200,000 markets and entire value chains for deeper understanding of the unmet insights along with market sizing and forecasts of niche markets. The new included chapters on Methodology and Benchmarking presented with high quality analytical infographics in our reports gives complete visibility of how the numbers have been arrived and defend the accuracy of the numbers.

We at MarketsandMarkets are inspired to help our clients grow by providing apt business insight with our huge market intelligence repository.

For more information, please visit http://www.marketsandmarkets.com/Market-Reports/switchgear-market-1162268.html

Contact Info:
Name: Rohan
Organization: MarketsandMarkets

Source: http://marketersmedia.com/switchgear-market-worth-144-41-billion-usd-by-2021/141901

Release ID: 141901

Opexa Therapeutics Announces Phase 2b Abili-T Trial of Tcelna(R) (imilecleucel-T) in Secondary Progressive Multiple Sclerosis Did Not Meet Primary Endpoint

THE WOODLANDS, TX / ACCESSWIRE / October 28, 2016 / Opexa Therapeutics (Nasdaq: OPXA), a biopharmaceutical company developing personalized immunotherapies for autoimmune disorders, today announced that the Phase 2b Abili-T clinical trial designed to evaluate the efficacy and safety of Tcelna® (imilecleucel-T) in patients with secondary progressive multiple sclerosis (SPMS) did not meet its primary endpoint of reduction in brain volume change (atrophy), nor did it meet the secondary endpoint of reduction of the rate of sustained disease progression. Tcelna did show a favorable safety and tolerability profile.

“We are disappointed that Tcelna did not meet the predefined endpoints in the Abili-T trial,” said Neil K. Warma, President and Chief Executive Officer of Opexa. “We will evaluate the full data set over the coming weeks and review cash preservation options while we consider the best path forward for the company.”

Abili-T is a 183-patient, randomized, double-blind, placebo-controlled Phase 2b study (ClinicalTrials.gov Identifier: NCT01684761) that was conducted at 35 clinical trial sites in the U.S. and Canada. Patients in the Tcelna arm of the study received two annual courses of Tcelna treatment consisting of five subcutaneous injections per year.

“We would like to express our sincere thanks to the patients in the Abili-T trial, as well as to the principal investigators and study coordinators, for their contributions to the study,” said Mr. Warma.

About Opexa Therapeutics

Opexa Therapeutics is a biopharmaceutical company developing personalized immunotherapies based on ImmPath®, its proprietary T-cell technology, with the potential to treat autoimmune diseases. Opexa’s staff of cell therapy experts operates in a stand-alone facility located on one acre in the Woodlands, Texas. The facility is comprised of over 10,000 sq. ft. of state of the art space for cGMP manufacturing suites, a quality control laboratory, a research and development laboratory, quality assurance, specialized flow cytometry, a microscopy lab and clinical and regulatory affairs, as well as warehouse space for materials management. Opexa’s patent estate is currently comprised of over 160 issued patents (domestic and international).

For more information, please visit Opexa Therapeutics’ website at www.opexatherapeutics.com or follow company news on Twitter via @OpexaCEO or LinkedIn.

Cautionary Statement Relating to Forward-Looking Information for the Purpose of “Safe Harbor” Provisions of the Private Securities Litigation Reform Act of 1995

Statements contained in this release, other than statements of historical fact, constitute “forward-looking statements” within the meaning of the Private Securities Litigation Reform Act of 1995. The words “expects,” “believes,” “may,” “intends,” “potential” and similar expressions are intended to identify forward-looking statements. These forward-looking statements do not constitute guarantees of future performance. Investors are cautioned that forward-looking statements, including without limitation statements regarding the safety, efficacy and projected development timeline of drug candidates such as Tcelna® and OPX-212 as well as the sufficiency of our resources, constitute forward-looking statements. These forward-looking statements are based upon our current expectations and involve assumptions that may never materialize or may prove to be incorrect. Actual results and the timing of events could differ materially from those anticipated in such forward-looking statements as a result of various risks and uncertainties, which include without limitation our ability to raise additional capital to continue our development programs, our ability to successfully develop potential products such as Tcelna and OPX-212, our ability to obtain, maintain and protect intellectual property rights (including for Tcelna and OPX-212), the ability of any of our potential products (such as Tcelna), assuming approval by applicable regulatory authorities (such as the Food and Drug Administration), to achieve commercial success, as well as other risks associated with the process of discovering, developing and commercializing drug candidates that are safe and effective for use as human therapeutics. These and other risks are described in detail in our SEC filings, including our Annual Report on Form 10-K for the year ended December 31, 2015 and our Quarterly Reports on Form 10-Q. All forward-looking statements contained in this release speak only as of the date on which they were first made by us, and we undertake no obligation to update such statements to reflect events that occur or circumstances that exist after such date.

Contact:

Opexa Therapeutics, Inc.
Camilla Zuckero
281.775.0609
czuckero@opexatherapeutics.com

SOURCE: Opexa Therapeutics, Inc.

ReleaseID: 447844

Global Prions Market 2016 Analysis and Forecast to 2020

Prions market size is also analyzed by geographic regions encompassing North America, Europe, Japan and Rest of World. Business profiles of 22 major companies are discussed in the report.

Pune, India – October 28, 2016 /MarketersMedia/ —

Global Prions Market

Prions Market Research report gives an insight into the global market for Prion Deactivation technologies, Post Mort em Testing for BSE and Prion Reduction Filters. The Prion related products include BSE detection test Kits, Deactivation/Inactivation technologies, Reagents and Services. The study includes estimations and predictions for the global BSE Post Mortem Testing Market. Prions market size is also analyzed by geographic regions encompassing North America, Europe, Japan and Rest of World. Business profiles of 22 major companies are discussed in the report.

Try Sample Report @ https://www.wiseguyreports.com/sample-request/30794-prions-market-research-report

The Prions market report serves as a complete guide to global Prion Detection, Reduction and Inactivation Market covering more than 230 companies that are engaged in research for development of antemortem BSE and CJD test kits, development and supply of BSE Test kits and development of prion Reduction Filters. Information related to recent product releases, product developments, partnerships, collaborations, and mergers and acquisitions is also covered in the report.

Report Highlights

Prions are considered unique as they replicate without the presence of nucleic acids. These are observed to replicate by modifying neighboring prions to conform to the required shape. After the completion of the protein reconfirmation the modified or mutated prion becomes infective. The reason that prions are gaining importance is because they cause certain neurodegenerative diseases in animals and humans, which are incurable as of date. Creutzfeldt-Jakob disease in humans and Bovine spongiform encephalopathy (mad cow disease) are two such examples.

For Detailed Reading Please visit WiseGuy Reports @ https://www.wiseguyreports.com/reports/30794-prions-market-research-report

The infected person or animal dies within months or even weeks after the symptoms start surfacing. Scientists across the world are anxiously waiting to unearth a link between the disease scrapie, which is commonly found in the goats and sheep with that of other diseases like bovine spongiform encephalopathy (BSE) and variant Creutzfeldt-Jakob disease (vCJD). This is expected to bring about a revolution in the field of both agriculture and pharmaceutical developments. The very information pertaining to this research created a widespread impact on the pharmaceutical industries and its development can be witnessed in proportion.
…… CONTINUED

Report by Chapter

Scope and Methodology:This chapter provides information regarding the research methodology, limitations of the study, market measuring units and exchange rates used.
Report Synopsis:Synopsis of the report summarizes the global market for Prion Deactivation technologies, Post Mortem Testing for BSE and Prion Reduction Filters. Global market is also analyzed by geographic regions including North America, Europe, Japan and Rest of World.
III. Market Dynamics: Market Dynamics provides information on global markets for Prions Deactivation Technologies. The chapter includes global market analysis by geographic regions; analysis of each region; brief business profiles of major global companies; and a glance at corporate activities such as mergers and acquisitions, partnerships, new product developments/launches etc. Also includes market trends and industry outlook.
…… CONTINUED

Company Insight Profiles List

Abbott Laboratories (USA)
Beckman Coulter, Inc (USA)
Bio-Rad Laboratories, Inc. (USA)
Chronix Biomedical GmbH (Germany)
Covance, Inc. (USA)
DuPont Industrial Biosciences (USA)
EMD Millipore Corporation (USA)
Eurofins Scientific S.A (France)
Eurogentec SA (Belgium)
…… CONTINUED

Buy this report @ https://www.wiseguyreports.com/checkout?currency=one_user-USD&report_id=30794

Why Buy This Report?
This report may help Strategists, Investors, Laboratories, Contract Research Organizations, Biotechnology & Healthcare Companies, Academic Professionals, Drug Approval Authorities, and Other Organizations to –
Identify Market Opportunities
Review and Analyze Global and Regional Markets
Gauge Market Potential for your Products
Identify Competition
Use Market Research for exploring new areas
Acquire Meaningful Guidelines for Strategic Planning
Gear up for Market Entry
Get Actionable Information

For more information or any query mail at sales@wiseguyreports.com

About Us
Wise Guy Reports is part of the Wise Guy Consultants Pvt. Ltd. and offers premium progressive statistical surveying, market research reports, analysis & forecast data for industries and governments around the globe. Wise Guy Reports understand how essential statistical surveying information is for your organization or association. Therefore, we have associated with the top publishers and research firms all specialized in specific domains, ensuring you will receive the most reliable and up to date research data available.

Contact Us:
Norah Trent
+1 646 845 9349 / +44 208 133 9349
Follow on LinkedIn: https://www.linkedin.com/company/wise-guy-research-consultants-pvt-ltd-?trk=biz-companies-cym

For more information, please visit https://www.wiseguyreports.com/reports/30794-prions-market-research-report

Contact Info:
Name: NORAH TRENT
Organization: WISE GUY RESEARCH CONSULTANTS PVT LTD

Source: http://marketersmedia.com/global-prions-market-2016-analysis-and-forecast-to-2020/141916

Release ID: 141916

Global Wind Turbine Towers Market Size, Competitive Landscape and Key Country Analysis to 2020

ResearchMoz added Latest Research Report titled ” Global Wind Turbine Towers Market 2016-2020: Worldwide Market Size, Shares, Trends, Growth, Survey and Forecast report ” to it’s Large Report database.

Albany, United States – October 28, 2016 /MarketersMedia/ —

Summary:-

– Latest report “Wind Turbine Towers, Update 2016 – Global Market Size, Average Price, Competitive Landscape and Key Country Analysis to 2020” offer comprehensive information and understanding of the global wind turbine tower market.
– The report offers in-depth analysis wind turbine tower market at global, regional (Asia-Pacific, Americas, Europe, and Middle East and Africa) and key countries (the US, Canada, Mexico, Brazil, Germany, the UK, France, India, China and South Africa) level.
– The report analyzes the wind turbine installations, tower market value and average tower price for the historical (2010-2015) and forecast (2016-2020) period.
– The report also includes global and country specific competitive landscape, drivers and restraints of the wind turbine tower market.
– The report is built using data and information sourced from proprietary databases, primary and secondary research, and in-house analysis by GlobalDatas team of industry experts.

Get a Sample Research PDF with TOC: http://www.researchmoz.us/enquiry.php?type=S&repid=841059

Scope

The scope of wind turbine tower market report includes –
– Regional analysis of wind turbine tower market in Asia-Pacific, Americas, Europe, and Middle East and Africa.
– Market size analysis of wind turbine tower with focus on wind turbine installations and number of towers installed annually and average price in the key countries such as the US, Canada, Mexico, Brazil, Germany, the UK, France, India, China and South Africa
– Competitive landscape with WTG manufacturers market share at global and in the key countries for 2015
– Drivers and challenges related to wind turbine tower market globally

Reasons to buy

The report will enhance your decision making capability in a more rapid and time sensitive manner. It will allow you to –
– Facilitate decision-making by analyzing historical and forecast data on wind turbine tower market
– Develop strategies based on developments in the wind turbine tower market
– Identify key partners and business-development avenues, based on an understanding of the movements of major competitors
– Respond to your competitors business structure, strategies and prospects

Table of Contents:-

1.1 List of Tables
1.2 List of Figures

2 Introduction
2.1 Wind Turbine Tower Market, Wind Power Overview
2.2 Wind Turbine Tower Market, Turbine Towers
2.2.1 Tubular Steel Towers
2.2.2 Concrete Towers
2.2.3 Hybrid Towers

Enquiry at: http://www.researchmoz.us/enquiry.php?type=E&repid=841059

3 Wind Turbine Tower Market, Global
3.1 Wind Turbine Tower Market, Global, Overview
3.2 Wind Turbine Tower Market, Global, Market Drivers
3.2.1 Reduction in the Raw Material Cost
3.2.2 Rise in Power Demand
3.2.3 Support Policies Enabling the Strong Wind Power Development
3.2.4 Increasing Need for Environmental Security Promoting Investment in Wind Energy
3.3 Wind Turbine Tower Market, Global, Market Restraints
3.3.1 Lack of Sufficient Grid infrastructure
3.3.2 Supply Chain Bottlenecks
3.3.3 Growing Wind Turbine Opposition Creates Hurdles
3.3.4 Logistic Challenges
3.4 Wind Turbine Tower Market, Global, Units Installed, 2010-2020

For more information, please visit http://www.researchmoz.us/wind-turbine-towers-update-2016-global-market-size-average-price-competitive-landscape-and-key-country-analysis-to-2020-report.html

Contact Info:
Name: Rohit Bhisey
Organization: Researchmoz Global Pvt. Ltd.
Address: 90 State Street, Albany, NY 12207
Phone: +1-518-621-2074

Source: http://marketersmedia.com/global-wind-turbine-towers-market-size-competitive-landscape-and-key-country-analysis-to-2020/141919

Release ID: 141919

Mobile Backend as a Service (BaaS) Market Global Research Report 2016

Backend as a Service (BaaS) Global Market – The research report highlights market research and industry analysis driven by in-depth business relevant news.

Pune, India – October 28, 2016 /MarketersMedia/ —

View Sample Report @ https://www.wiseguyreports.com/sample-request/716372-global-mobile-backend-as-a-service-baas-market-research-report-2016

This report studies Mobile Backend as a Service (BaaS) in Global market, especially in North America, Europe, China, Japan, Southeast Asia and India, focuses on top manufacturers in global market, with production, price, revenue and market share for each manufacturer, covering
• Oracle Corporation
• IBM Corporation
• Microsoft Corporation
• Anypresence
• Appcelerator
• Built Io Backend
• KII Corporation
• Cloudmine
• Kony
• Kinvey

Market Segment by Regions, this report splits Global into several key Regions, with production, consumption, revenue, market share and growth rate of Mobile Backend as a Service (BaaS) in these regions, from 2011 to 2021 (forecast), like
• North America
• Europe
• China
• Japan
• Southeast Asia
• India

Split by product type, with production, revenue, price, market share and growth rate of each type, can be divided into
• Android
• iOS
• Others (Blackberry and Window OS)

Split by application, this report focuses on consumption, market share and growth rate of Mobile Backend as a Service (BaaS) in each application, can be divided into
• Data and application integration
• Identity and access management
• Usage analytics
• Support and maintenance Service

Access Report @ https://www.wiseguyreports.com/reports/716372-global-mobile-backend-as-a-service-baas-market-research-report-2016

Table of Contents:

Global Mobile Backend as a Service (BaaS) Market Research Report 2016
1 Mobile Backend as a Service (BaaS) Market Overview
1.1 Product Overview and Scope of Mobile Backend as a Service (BaaS)
1.2 Mobile Backend as a Service (BaaS) Segment by Type
1.2.1 Global Production Market Share of Mobile Backend as a Service (BaaS) by Type in 2015
1.2.2 Android
1.2.3 iOS
1.2.4 Others (Blackberry and Window OS)
1.3 Mobile Backend as a Service (BaaS) Segment by Application
1.3.1 Mobile Backend as a Service (BaaS) Consumption Market Share by Application in 2015
1.3.2 Data and application integration
1.3.3 Identity and access management
1.3.4 Usage analytics
1.3.5 Support and maintenance Service
1.4 Mobile Backend as a Service (BaaS) Market by Region
1.4.1 North America Status and Prospect (2011-2021)
1.4.2 Europe Status and Prospect (2011-2021)
1.4.3 China Status and Prospect (2011-2021)
1.4.4 Japan Status and Prospect (2011-2021)
1.4.5 Southeast Asia Status and Prospect (2011-2021)
1.4.6 India Status and Prospect (2011-2021)
1.5 Global Market Size (Value) of Mobile Backend as a Service (BaaS) (2011-2021)

2 Global Mobile Backend as a Service (BaaS) Market Competition by Manufacturers
2.1 Global Mobile Backend as a Service (BaaS) Production and Share by Manufacturers (2015 and 2016)
2.2 Global Mobile Backend as a Service (BaaS) Revenue and Share by Manufacturers (2015 and 2016)
2.3 Global Mobile Backend as a Service (BaaS) Average Price by Manufacturers (2015 and 2016)
2.4 Manufacturers Mobile Backend as a Service (BaaS) Manufacturing Base Distribution, Sales Area and Product Type
2.5 Mobile Backend as a Service (BaaS) Market Competitive Situation and Trends
2.5.1 Mobile Backend as a Service (BaaS) Market Concentration Rate
2.5.2 Mobile Backend as a Service (BaaS) Market Share of Top 3 and Top 5 Manufacturers
2.5.3 Mergers & Acquisitions, Expansion

Manufacturers Profiles :-

7 Global Mobile Backend as a Service (BaaS) Manufacturers Profiles/Analysis
7.1 Oracle Corporation
7.1.1 Company Basic Information, Manufacturing Base and Its Competitors
7.1.2 Mobile Backend as a Service (BaaS) Product Type, Application and Specification
7.1.2.1 Type I
7.1.2.2 Type II
7.1.3 Oracle Corporation Mobile Backend as a Service (BaaS) Production, Revenue, Price and Gross Margin (2015 and 2016)
7.1.4 Main Business/Business Overview

7.2 IBM Corporation
7.2.1 Company Basic Information, Manufacturing Base and Its Competitors
7.2.2 Mobile Backend as a Service (BaaS) Product Type, Application and Specification
7.2.2.1 Type I
7.2.2.2 Type II
7.2.3 IBM Corporation Mobile Backend as a Service (BaaS) Production, Revenue, Price and Gross Margin (2015 and 2016)
7.2.4 Main Business/Business Overview

7.3 Microsoft Corporation
7.3.1 Company Basic Information, Manufacturing Base and Its Competitors
7.3.2 Mobile Backend as a Service (BaaS) Product Type, Application and Specification
7.3.2.1 Type I
7.3.2.2 Type II
7.3.3 Microsoft Corporation Mobile Backend as a Service (BaaS) Production, Revenue, Price and Gross Margin (2015 and 2016)
7.3.4 Main Business/Business Overview

7.4 Anypresence
7.4.1 Company Basic Information, Manufacturing Base and Its Competitors
7.4.2 Mobile Backend as a Service (BaaS) Product Type, Application and Specification
7.4.2.1 Type I
7.4.2.2 Type II
7.4.3 Anypresence Mobile Backend as a Service (BaaS) Production, Revenue, Price and Gross Margin (2015 and 2016)
7.4.4 Main Business/Business Overview

7.5 Appcelerator
7.5.1 Company Basic Information, Manufacturing Base and Its Competitors
7.5.2 Mobile Backend as a Service (BaaS) Product Type, Application and Specification
7.5.2.1 Type I
7.5.2.2 Type II
7.5.3 Appcelerator Mobile Backend as a Service (BaaS) Production, Revenue, Price and Gross Margin (2015 and 2016)
7.5.4 Main Business/Business Overview

7.6 Built Io Backend
7.6.1 Company Basic Information, Manufacturing Base and Its Competitors
7.6.2 Mobile Backend as a Service (BaaS) Product Type, Application and Specification
7.6.2.1 Type I
7.6.2.2 Type II
7.6.3 Built Io Backend Mobile Backend as a Service (BaaS) Production, Revenue, Price and Gross Margin (2015 and 2016)
7.6.4 Main Business/Business Overview

7.7 KII Corporation
7.7.1 Company Basic Information, Manufacturing Base and Its Competitors
7.7.2 Mobile Backend as a Service (BaaS) Product Type, Application and Specification
7.7.2.1 Type I
7.7.2.2 Type II
7.7.3 KII Corporation Mobile Backend as a Service (BaaS) Production, Revenue, Price and Gross Margin (2015 and 2016)
7.7.4 Main Business/Business Overview

7.8 Cloudmine
7.8.1 Company Basic Information, Manufacturing Base and Its Competitors
7.8.2 Mobile Backend as a Service (BaaS) Product Type, Application and Specification
7.8.2.1 Type I
7.8.2.2 Type II
7.8.3 Cloudmine Mobile Backend as a Service (BaaS) Production, Revenue, Price and Gross Margin (2015 and 2016)
7.8.4 Main Business/Business Overview

7.9 Kony
7.9.1 Company Basic Information, Manufacturing Base and Its Competitors
7.9.2 Mobile Backend as a Service (BaaS) Product Type, Application and Specification
7.9.2.1 Type I
7.9.2.2 Type II
7.9.3 Kony Mobile Backend as a Service (BaaS) Production, Revenue, Price and Gross Margin (2015 and 2016)
7.9.4 Main Business/Business Overview

7.10 Kinvey
7.10.1 Company Basic Information, Manufacturing Base and Its Competitors
7.10.2 Mobile Backend as a Service (BaaS) Product Type, Application and Specification
7.10.2.1 Type I
7.10.2.2 Type II
7.10.3 Kinvey Mobile Backend as a Service (BaaS) Production, Revenue, Price and Gross Margin (2015 and 2016)
7.10.4 Main Business/Business Overview

…CONTINUED

Buy this Report @ https://www.wiseguyreports.com/checkout?currency=one_user-USD&report_id=716372

For more information, please visit http://www.wiseguyreports.com

Contact Info:
Name: NORAH TRENT
Email: info@wiseguyreports.com
Organization: WISE GUY RESEARCH CONSULTANTS PVT LTD
Address: Office No. 528, Amanora Chambers, Magarpatta Road, Hadapsar, Pune – 411028
Phone: +91 841 198 5042

Source: http://marketersmedia.com/mobile-backend-as-a-service-baas-market-global-research-report-2016/141921

Release ID: 141921