Monthly Archives: October 2016

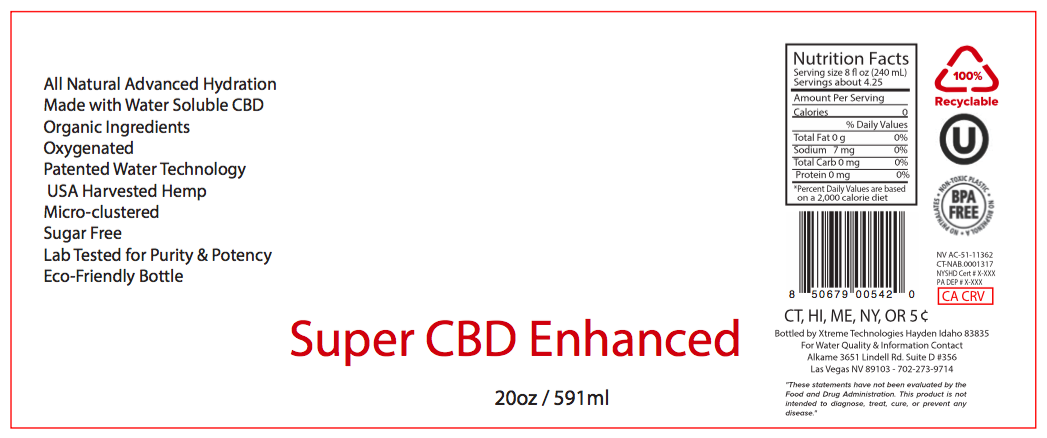
Puration Previews EVERx CBD Infused Bottled Water Logo and Package Label

DALLAS, TX / ACCESSWIRE / October 27, 2016 / Puration, Inc. (OTC: PURA) previewed the logo design and package label for its recently introduced EVERx CBD infused water line announced earlier this week. Puration is targeting an initial $1 million in 2017 sales of EVERx CBD infused water into the health conscious bottled water consumer market. The bottled water market was valued at US $157.27 billion in 2013 and is expected to reach US $279.65 billion by 2020 (Transparency Market Research). Given the magnitude of the bottled water market, management plans to review first quarter performance and potentially increase the first year target at that time.

The EVERx Sports and Fitness Nutritional Supplement Brand

Puration has partnered with North American Cannabis Holdings, Inc. (USMJ) to produce a beverage under the North American Cannabis Holdings EVERx Sports and Fitness Nutritional Supplement Brand Name. EVERx CBD infused water will be marketed and sold by Puration in a campaign designed to complement the comprehensive EVERx brand. EVERx supplements are designed for men and women of EVERY age seeking to sustain a healthy and fit lifestyle through EVERY stage of life and for EVERY fitness objective from weight loss and muscle building, to injury prevention and rehabilitation; from general fitness to extreme endurance and competitive athletic performance.

The EVERx CBD Infused Water Science and Technology

Puration has contracted with Alkame Holdings, Inc. (OTC: ALKM) to produce a variety of flavored EVERx functional waters infused with CBD extracted through Puration’s Proprietary Process. These extractions, combined with Alkame’s patented water treatment technologies, are designed to enhance the absorption of CBD into the body in addition to providing additional independent health and wellness benefits.

Alkame’s patented technology alters the structure of water, producing a combination of characteristics that are unprecedented in the beverage industry. The technology breaks down the hydrogen bonds, reducing water’s cluster size, which provides an efficient delivery system for the CBD when infused with the water. Separate from the infused CBD, the technology includes an optimal alkaline pH level formulated with antioxidants and electrolytes for effective hydration.

The EVERx CBD Infused Water Target Market

EVERx will target the growing number of recreational and competitive athletes citing CBD for its benefits in substantially reducing recovery times and increasing cardio output as well as accelerating the healing process from injury and preventing against future injury. EVERx will also target the general consumer that is becoming more aware of the antioxidant and neural- protective research backed benefits of CBD. Research has shown CBD to mitigate diabetes risk and reduce cancer cells among demonstrating other specific targeted uses.

To learn more about Puration: Purationinc.com
Follow Puration on Twitter: Puration710
Visit Puration on Facebook: facebook.com/puration/

About Alkame Holdings, Inc.

Alkame Holdings, Inc. is a publicly traded health and wellness technology holding company, with a focus on patentable, innovative, and eco-friendly consumer products. The Company’s wholly-owned subsidiaries market and distribute enhanced waters utilizing an exclusive patented formula and technology to create water with several unique properties. The organization is diligently building a strong foundation through the launch and acquisition of appropriate business assets, and by pursuing multiple applications to utilize its Intellectual property by placement into several emerging business sectors, such as the growing aqua-culture industry, consumer bottled water and RTD products, household pet products, horticulture and agriculture applications, as well as many other various water treatment solutions to both new and existing business platforms.

For more information, visit: alkameholdingsinc.com or cbdcopacker.com

Safe Harbor Act: This release includes forward-looking statements made pursuant to the safe harbor provisions of the Private Securities Litigation Reform Act of 1995 that involves risks and uncertainties including, but not limited to, the impact of competitive products, the ability to meet customer demand, the ability to manage growth, acquisitions of technology, equipment, or human resources, the effect of economic business conditions and the ability to attract and retain skilled personnel. The Company is not obligated to revise or update any forward-looking statements in order to reflect events or circumstances that may arise after the date of this release.

Puration Contact:

Brian Shibley, CEO
info@puraitoninc.com
+1-972-528-0162

SOURCE: Puration

ReleaseID: 447817

Kesselrun Resources Update Regarding Court Proceedings Against First Mining Finance

THUNDER BAY, ON / ACCESSWIRE / October 27, 2016 / Kesselrun Resources Ltd. (TSXV: KES) (“Kesselrun” or the “Company”) would like to update shareholders regarding its filed Notice of Application with the Ontario Superior Court of Justice – Commercial List (see Kesselrun press release dated October 12, 2016) in connection with its previously announced dispute with First Mining Finance Corp. (TSXV:FF) (“First Mining”) and it’s wholly-owned subsidiary, Tamaka Gold Corporation (“Tamaka”) concerning three senior unsecured convertible debentures of Tamaka held by Kesselrun in the aggregate principal amount of $2,139,900 (the “Convertible Debentures”).

The Convertible Debentures are automatically convertible into common shares of Tamaka at a prescribed rate upon the occurrence of a “Liquidity Event” (see Kesselrun press release dated November 20, 2013). As previously announced, Kesselrun believes that the recent transaction (the “Acquisition”) pursuant to which Tamaka became a wholly-owned subsidiary of First Mining constituted a Liquidity Event and a change of control of Tamaka pursuant to the terms of the Convertible Debentures, and should have resulted in an automatic conversion of the Convertible Debentures effective immediately prior to the closing of the Acquisition. First Mining has asserted that there was no Liquidity Event.

Kesselrun has made an application for:

a declaration that the Acquisition was a “Liquidity Event” pursuant to the Convertible Debentures;

a mandatory and permanent injunction requiring the respondents to issue to Kesselrun approximately 5,636,122 common shares of First Mining;

in the alternative, payment of an amount that will permit Kesselrun to purchase the First Mining common shares referred to above;

in the alternative, damages for breach of contract;

pre and post-judgment interest at the rate of 10% per annum in accordance with the Convertible Debentures;

payment of all losses, costs and expenses (including, without limitation, reasonable solicitors’ fees and disbursements) incurred in connection with the enforcement of the Convertible Debentures;

costs of this proceeding on a substantial indemnity basis, plus all applicable taxes; and

such further and other relief as the Honourable Court may deem just.

Cassels Brock & Blackwell LLP, a leading law firm in the mining sector, is representing Kesselrun in regards to the above matters.

Kesselrun will provide further updates in due course as they become available.

About Kesselrun Resources Ltd.

Kesselrun Resources is a Thunder Bay, Ontario-based mineral exploration company focused on growth through property acquisitions and discoveries. Kesselrun’s management team possesses strong geological and exploration expertise with particular experience in Northwest Ontario. For more information about Kesselrun Resources, please visit www.kesselrunresources.com.

Neither the TSX Venture Exchange nor its Regulation Services Provider (as that term is defined in the policies of the TSX Venture Exchange) accepts responsibility for the adequacy or accuracy of this news release.

For additional information please contact:

Kesselrun Resources Ltd.

Michael Thompson, P. Geo., President & CEO
807.285.3323
michaelt@kesselrunresources.com

Corporate Communications
1.866.416.7941
information@kesselrunresources.com

Forward Looking Statements – Certain information set forth in this news release may contain forward-looking statements that involve substantial known and unknown risks and uncertainties. These forward-looking statements are subject to numerous risks and uncertainties, certain of which are beyond the control of Kesselrun, including, but not limited to the ultimate interpretation of the terms of the Convertible Debentures in the context of the Acquisition, the potential outcome of the dispute and the costs associated therewith, and the impact of general economic conditions. Readers are cautioned that the assumptions used in the preparation of such information, although considered reasonable at the time of preparation, may prove to be imprecise and, as such, undue reliance should not be placed on forward-looking statements.

SOURCE: Kesselrun Resources Ltd.

ReleaseID: 447818

Research Reports Initiated on Financials Stocks AGF Management, Westaim, Founders Advantage Capital, and Gluskin Sheff and Associates

LONDON, UK / ACCESSWIRE / October 27, 2016 / Active Wall St. announces the list of stocks for today’s research reports. Pre-market the Active Wall St. team provides the technical coverage impacting selected stocks trading on the Toronto Exchange and belonging under the Asset Management industry. Companies recently under review include AGF Management, Westaim, Founders Advantage Capital, and Gluskin Sheff + Associates. Get all of our free research reports by signing up at: http://www.activewallst.com/register/.

On Wednesday, October 26, 2016, the Toronto Exchange Composite Index was down 0.42%, finishing the day at 14,807.56. The TSX Venture Composite Index, on the other hand, closed at 775.39, down 1.31%.

The Financials Index was in the black, closing the day at 260.56, up 0.36%.

Active Wall St. has initiated research reports on the following equities: AGF Management Ltd. (TSX: AGF-B), The Westaim Corporation (TSX-V: WED), Founders Advantage Capital Corporation (TSX-V: FCF), and Gluskin Sheff + Associates Inc. (TSX: GS). Register with us now for your free membership and research reports at: http://www.activewallst.com/register/.

AGF Management Ltd.

Toronto, Canada-based AGF Management Ltd.’s stock lost 1.34%, to finish Wednesday’s session at $5.16 with a total volume of 101,189 shares traded. Over the last one month and the previous three months, AGF Management’s shares have advanced 3.41% and 0.98%, respectively. Further, the stock has edged 0.19% higher in the past one year. Shares of the Company, which through its subsidiaries, the firm provides its services to public and corporate DB pension plans, endowments and foundations, sovereign wealth funds, corporate plans, insurance companies, and sub-advised mandates, are trading above its 50-day and 200-day moving averages. AGF Management’s 200-day moving average of $5.07 is above its 50-day moving average of $5.01. The Company’s shares traded at a PE ratio of 11.65. See our research report on AGF-B.TO at: http://www.activewallst.com/registration-3/?symbol=AGF.B.

The Westaim Corp.

Toronto, Canada-based The Westaim Corp.’s stock closed the day flat at $2.60. The stock recorded a trading volume of 39,169 shares. Shares of Westaim, which specializes in direct and indirect investments through acquisitions, joint ventures, secondary investing both direct and indirect, fund of fund investments, and other arrangements, are trading below their 50-day and 200-day moving averages. Moreover, the stock’s 50-day moving average of $2.68 is greater than its 200-day moving average of $2.64. The complimentary research report on WED.V at: http://www.activewallst.com/registration-3/?symbol=WED.

Founders Advantage Capital Corp.

On Wednesday, shares in Alberta, Canada-based Founders Advantage Capital Corp. ended the session 8.41% lower at $3.16 with a total volume of 3,705 shares traded. Shares of Founders Advantage Capital, which invests in equity, debt, or other securities of publicly traded companies or middle market privately held entities; and offers financing services in exchange for pre-determined royalties or distributions, have rallied 1,115.38% in the past one year. The stock is trading below its 50-day and 200-day moving averages. Furthermore, the company’s 50-day moving average of $3.67 is greater than its 200-day moving average of $3.40. Register for free and access the latest research report on FCF.V at: http://www.activewallst.com/registration-3/?symbol=FCF.

Gluskin Sheff + Associates Inc.

On Wednesday, shares in Toronto, Canada-based Gluskin Sheff + Associates Inc. recorded a trading volume of 49,266 shares. The stock ended the day 0.06% higher at $16.17. Gluskin Sheff + Associates Inc.’s stock is trading below its 50-day and 200-day moving averages. The stock’s 200-day moving average of $17.11 is above its 50-day moving average of $16.61. Shares of the Company, which provides its services to high net worth investors, including entrepreneurs, professionals, family trusts, private charitable foundations, pension and profit sharing plans, pooled investment vehicles, charitable organizations, corporations, institutions, insurance companies, and estates, are trading at PE ratio of 14.70. Get free access to your research report on GS.TO at: http://www.activewallst.com/registration-3/?symbol=GS.

Active Wall Street:

Active Wall Street (AWS) produces regular sponsored and non-sponsored reports, articles, stock market blogs, and popular investment newsletters covering equities listed on NYSE and NASDAQ and micro-cap stocks. AWS has two distinct and independent departments. One department produces non-sponsored analyst certified content generally in the form of press releases, articles and reports covering equities listed on NYSE and NASDAQ and the other produces sponsored content (in most cases not reviewed by a registered analyst), which typically consists of compensated investment newsletters, articles and reports covering listed stocks and micro-caps. Such sponsored content is outside the scope of procedures detailed below.

AWS has not been compensated; directly or indirectly; for producing or publishing this document.

PRESS RELEASE PROCEDURES:

The non-sponsored content contained herein has been prepared by a writer (the “Author”) and is fact checked and reviewed by a third party research service company (the “Reviewer”) represented by a credentialed financial analyst, for further information on analyst credentials, please email info@activewallst.com. Rohit Tuli, a CFA® charterholder (the “Sponsor”), provides necessary guidance in preparing the document templates. The Reviewer has reviewed and revised the content, as necessary, based on publicly available information which is believed to be reliable. Content is researched, written and reviewed on a reasonable-effort basis. The Reviewer has not performed any independent investigations or forensic audits to validate the information herein. The Reviewer has only independently reviewed the information provided by the Author according to the procedures outlined by AWS. AWS is not entitled to veto or interfere in the application of such procedures by the third-party research service company to the articles, documents or reports, as the case may be. Unless otherwise noted, any content outside of this document has no association with the Author or the Reviewer in any way.

NO WARRANTY

AWS, the Author, and the Reviewer are not responsible for any error which may be occasioned at the time of printing of this document or any error, mistake or shortcoming. No liability is accepted whatsoever for any direct, indirect or consequential loss arising from the use of this document. AWS, the Author, and the Reviewer expressly disclaim any fiduciary responsibility or liability for any consequences, financial or otherwise arising from any reliance placed on the information in this document. Additionally, AWS, the Author, and the Reviewer do not (1) guarantee the accuracy, timeliness, completeness or correct sequencing of the information, or (2) warrant any results from use of the information. The included information is subject to change without notice.

NOT AN OFFERING

This document is not intended as an offering, recommendation, or a solicitation of an offer to buy or sell the securities mentioned or discussed, and is to be used for informational purposes only. Please read all associated disclosures and disclaimers in full before investing. Neither AWS nor any party affiliated with us is a registered investment adviser or broker-dealer with any agency or in any jurisdiction whatsoever. To download our report(s), read our disclosures, or for more information, visit http://www.activewallst.com/disclaimer/.

CONTACT

For any questions, inquiries, or comments reach out to us directly. If you’re a company we are covering and wish to no longer feature on our coverage list contact us via email and/or phone between 09:30 EDT to 16:00 EDT from Monday to Friday at:

Email: info@activewallst.com
Phone number: 1-858-257-3144

Office Address: 3rd floor, 207 Regent Street, London, W1B 3HH, United Kingdom

CFA® and Chartered Financial Analyst® are registered trademarks owned by CFA Institute.

SOURCE: Active Wall Street

ReleaseID: 447804

Post Earnings Coverage as Werner Q3 Topline Outperformed Forecasts

LONDON, UK / ACCESSWIRE / October 27, 2016 / Active Wall St. announces its post-earnings coverage on Werner Enterprises Inc. (NASDAQ: WERN). The company released its financial results for the third quarter fiscal 2016 (Q3 FY16) on October 20, 2016. The Omaha, Nebraska-based company’s total revenue fell 4.8% y-o-y during the reported period; however it beat analysts’ estimates. Register with us now for your free membership at: http://www.activewallst.com/register/.

Today, AWS is promoting its earnings coverage on WERN. Get our free coverage by signing up to http://www.activewallst.com/registration-3/?symbol=WERN.

Earnings Reviewed

During Q3 FY16, Werner Enterprises reported total revenue of $508.68 million, which was below $534.45 million recorded at the end of Q3 FY15. However, the company’s quarterly total revenue numbers outperformed Wall Street’s expectations of $498.5 million.

The transportation company’s net income for Q3 FY16 came in at $18.92 million, or $0.26 per diluted common share, compared to $32.08 million, or $0.44 per diluted common share, in the prior year’s quarter. Market analysts had also expected the company to report EPS of $0.26 per diluted share for the reported quarter.

In Q3 FY16, the company averaged 7,216 trucks in service in the Truckload segment and 75 intermodal drayage trucks in the Werner Enterprises Logistics segment. The company ended the quarter with 7,175 trucks in the Truckload segment, which was 240 trucks lower on y-o-y basis. Furthermore, the company’s Specialized service unit ended the quarter with 3,930 trucks, which was 90 trucks lower on a sequential basis.

Operating Metrics

For Q3 FY16, the trucking company’s operating income came in at $29.07 million compared to $52.80 million in the year ago period. In Q3 FY16, average revenues per tractor per week declined 4.7% y-o-y to $3,589 from $3,767 in Q3 FY15. The company attributed this decline to a 3.5% fall in average miles per truck along with a 1.2% decrease in average revenues per total mile.

Segment Performance

During the quarter ended September 30, 2016, Truckload Transportation Services segment revenue came in at $384.31 million compared to $417.86 million in the year ago period. The segment reported an operating income of $19.85 million versus $48.75 million in Q3 FY15. Excluding fuel surcharge revenues, a volatile source of revenue, the segment’s operating ratio was 94.8% compared to 88.3% in the year ago quarter.

Werner Enterprises’ Logistics segment generated revenue amounting to $10.46 million, which was 7% above the last year’s recorded revenue numbers of $102.15 million. In Q3 FY16, Werner Enterprises Logistics’ gross margin came in at 16.2% of the segment’s operating revenues, which was a 50 basis points improvement from 15.7% of segment operating revenues recorded in Q3 FY15. Furthermore, the operating income for Q3 FY16 stood at $4.89 million, or 4.5% of segment operating revenues compared to $5.02 million, or 4.9% of segment operating revenues reported in the year ago comparable quarter.

Cash Flow & Balance Sheet

In the three quarters ended on September 30, 2016, Werner Enterprises generated $30.15 million of cash from operations compared to $89.20 million reported in the previous year’s comparable period. The company had $13.74 million of cash and cash equivalents as on September 30, 2016, compared to $31.83 million at the close of books on December 31, 2015.

During the reported quarter, the company spent $33.49 million as capital expenditures compared to $91.70 million in Q3 FY15. Furthermore, the company’s long-term debt increased to $150.00 million as on September 30, 2016 from $75.00 million recorded on December 30, 2015.

As on September 30, 2016, the company provided annualized return on assets of 4.4% compared to 8.4% recorded at the end of last year’s comparable quarter. Additionally, annualized return on equity stood at 7.8% as on September 30, 2016, versus 14.4% as on September 30, 2015.

Stock Performance

Werner Enterprises’ stock is trading slightly up 0.1%, closing Wednesday’s session at $24.15 on volume of 1.27 million shares, which was above the 3 months average volume of 725.65 thousand shares. The stock has advanced 6.57% in the last month. Additionally, the company’s shares gained 4.01% since the beginning of the year. The company’s shares are trading a PE ratio of 16.34 and have a dividend yield of 0.99%.

Active Wall Street:

Active Wall Street (AWS) produces regular sponsored and non-sponsored reports, articles, stock market blogs, and popular investment newsletters covering equities listed on NYSE and NASDAQ and micro-cap stocks. AWS has two distinct and independent departments. One department produces non-sponsored analyst certified content generally in the form of press releases, articles and reports covering equities listed on NYSE and NASDAQ and the other produces sponsored content (in most cases not reviewed by a registered analyst), which typically consists of compensated investment newsletters, articles and reports covering listed stocks and micro-caps. Such sponsored content is outside the scope of procedures detailed below.

AWS has not been compensated; directly or indirectly; for producing or publishing this document.

PRESS RELEASE PROCEDURES:

The non-sponsored content contained herein has been prepared by a writer (the “Author”) and is fact checked and reviewed by a third party research service company (the “Reviewer”) represented by a credentialed financial analyst, for further information on analyst credentials, please email info@activewallst.com. Rohit Tuli, a CFA® charterholder (the “Sponsor”), provides necessary guidance in preparing the document templates. The Reviewer has reviewed and revised the content, as necessary, based on publicly available information which is believed to be reliable. Content is researched, written and reviewed on a reasonable-effort basis. The Reviewer has not performed any independent investigations or forensic audits to validate the information herein. The Reviewer has only independently reviewed the information provided by the Author according to the procedures outlined by AWS. AWS is not entitled to veto or interfere in the application of such procedures by the third-party research service company to the articles, documents or reports, as the case may be. Unless otherwise noted, any content outside of this document has no association with the Author or the Reviewer in any way.

NO WARRANTY

AWS, the Author, and the Reviewer are not responsible for any error which may be occasioned at the time of printing of this document or any error, mistake or shortcoming. No liability is accepted whatsoever for any direct, indirect or consequential loss arising from the use of this document. AWS, the Author, and the Reviewer expressly disclaim any fiduciary responsibility or liability for any consequences, financial or otherwise arising from any reliance placed on the information in this document. Additionally, AWS, the Author, and the Reviewer do not (1) guarantee the accuracy, timeliness, completeness or correct sequencing of the information, or (2) warrant any results from use of the information. The included information is subject to change without notice.

NOT AN OFFERING

This document is not intended as an offering, recommendation, or a solicitation of an offer to buy or sell the securities mentioned or discussed, and is to be used for informational purposes only. Please read all associated disclosures and disclaimers in full before investing. Neither AWS nor any party affiliated with us is a registered investment adviser or broker-dealer with any agency or in any jurisdiction whatsoever. To download our report(s), read our disclosures, or for more information, visit http://www.activewallst.com/disclaimer/.

CONTACT

For any questions, inquiries, or comments reach out to us directly. If you’re a company we are covering and wish to no longer feature on our coverage list contact us via email and/or phone between 09:30 EDT to 16:00 EDT from Monday to Friday at:

Email: info@activewallst.com
Phone number: 1-858-257-3144

Office Address: 3rd floor, 207 Regent Street, London, W1B 3HH, United Kingdom

CFA® and Chartered Financial Analyst® are registered trademarks owned by CFA Institute.

SOURCE: Active Wall Street

ReleaseID: 447813

Fiore Exploration Commences Drill Program at Pampas El Peñon Project

VANCOUVER, BC / ACCESSWIRE / October 27, 2016 / FIORE EXPLORATION LTD. (TSXV: F) (“Fiore” or the “Company”) is pleased to announce that an 8,000 m reverse circulation drilling program has begun on its Pampas El Peñon project in Chile, with the first hole currently underway. The drilling program is targeting high-grade epithermal gold-silver veins like those currently being mined at the adjacent Pampas Augusta Victoria (“PAV”) zone at Yamana Gold’s flagship El Peñon Mine (see figure 1).

Tim Warman, Fiore’s CEO stated, “Just two months after acquiring this promising exploration ground immediately adjacent to an operating world-class mine, we’ve completed a geophysical survey and have begun drilling our top priority targets. We look forward to seeing the drill results over the next weeks and months, and are also in discussions for additional property acquisitions as we continue to grow the company.”

The first holes will be drilled on Fiore’s southwestern concession block where a total of five targets have been identified through mapping, surface sampling and geophysical surveying (see figure 2). The first target, W1, is an outcropping rhyolite dome with a coincident arsenic-antimony anomaly and a low magnetic susceptibility signature that extends for at least 1.7km in a north-south direction. The second target, W2, is an outcropping jasperoid breccia body, also with elevated arsenic and antimony values and low magnetic susceptibility. Antinomy and arsenic are both common pathfinder elements for epithermal gold deposits, and are strongly associated with epithermal gold-silver veins at the adjacent El Peñon mine. The other three targets identified on the southwestern concession block occur beneath alluvial cover but exhibit the same low magnetic susceptibility signature as the outcropping targets.

In Fiore’s northern concession block, two high-priority and several secondary targets have been identified by our recent geophysical survey (see figure 2). The northern block is almost entirely covered by alluvium and drilling here will be dependent on the results of the initial drill holes on the southwestern concession.

Reverse circulation (“RC”) drilling has been used extensively by Yamana at the adjacent El Peñon mine, and will provide confirmation as to whether similar epithermal gold-silver veins occur at Pampas El Peñon. Follow up drilling will be carried out using a combination of RC and diamond drilling.

Vern Arseneau, P. Geo., Fiore’s VP Exploration, is the Qualified Person who supervised the preparation of the technical data in this news release.

About Fiore Exploration

Fiore Exploration is a Latin America focused gold explorer, whose main project is the Pampas El Peñon gold project in Chile, which covers land in the same geological environment as Yamana’s flagship El Peñon mine.

On behalf of FIORE EXPLORATION LTD.

“Tim Warman”
Chief Executive Officer

Contact Us:

info@fioreexploration.com
1(416) 639-1426 Ext. 1

Neither the TSX Venture Exchange nor its Regulation Services Provider (as that term is defined in the policies of the TSX Venture Exchange) accepts responsibility for the adequacy or accuracy of this release.

Disclaimer for Forward-Looking Information

“This press release contains “forward-looking information” and “forward-looking statements” within the meaning of applicable securities laws. This information and statements address future activities, events, plans, developments and projections. All statements, other than statements of historical fact, constitute forward-looking statements or forward-looking information. Such forward-looking information and statements are frequently identified by words such as “may,” “will,” “should,” “anticipate,” “plan,” “expect,” “believe,” “estimate,” “intend” and similar terminology, and reflect assumptions, estimates, opinions and analysis made by management of the Company in light of its experience, current conditions, expectations of future developments and other factors which it believes to be reasonable and relevant. Forward-looking information and statements involve known and unknown risks and uncertainties that may cause the Company’s actual results, performance and achievements to differ materially from those expressed or implied by the forward-looking information and statements and accordingly, undue reliance should not be placed thereon.

Risks and uncertainties that may cause actual results to vary include but are not limited to the availability of financing; fluctuations in commodity prices; changes to and compliance with applicable laws and regulations, including environmental laws and obtaining requisite permits; political, economic and other risks; as well as other risks and uncertainties which are more fully described in our annual and quarterly Management’s Discussion and Analysis and in other filings made by us with Canadian securities regulatory authorities and available at www.sedar.com. The Company disclaims any obligation to update or revise any forward-looking information or statements except as may be required.”

SOURCE: Fiore Exploration Ltd

ReleaseID: 447757

Recently Launched Viral Loop 2.0 Creates Buzz, As Premium Guide & Walk-Thru Released by eMarketingChamps

Recently launched Viral Loop 2.0 creates buzz In web marketing review circles, as premium bonus package released by eMarketingChamps. Twitter offers advertisers improved customer targeting.

Milwaukee, United States – October 27, 2016 /MarketersMedia/ —

The recently launched Viral Loop 2.0 is creating buzz in web marketing review circles due to its claim of helping users get targeted viral traffic. The launch of ViralLoop 2.0 is well-timed to capitalize the findings of a new report showing that Twitter is improving targeting metrics for their advertisers.

Hanif Quentino, founder of eMarketing Champs, has released a complete review and premium bonus for the Viral Loop 2.0 software, which can be viewed on his site:
[+]http://emarketingchamps.com/viral-loop-2/

Hanif considers himself as a legitimate Viral Loop 2.0 review critic, mainly because of his extensive experience with social media marketing and user engagement methods. Hanif recommends that Viral Loop users take advantage of Twitter’s updated advertising platform.

Twitter is offering its advertisers more options for targeting potential customers than before. Twitter is dividing its previous program, Website Clicks or Conversions, into two separate programs: one of Website Clicks and another of Website Conversions. Now advertisers can decide if they want to just drive any traffic to their sites, or if they’d prefer to get people to perform a desired action. If a company only cares about gaining new traffic to its website, then nothing will change except that when they select an ad campaign objective, the name will be different. For companies who prefer to motivate potential customers to do a specific action on their website, Twitter is making a greater effort to draw in those people and show the ads to them, specifically.

In order to use the new objective program, the advertiser must place the Twitter website tag on their site, so that people using the site can be tracked by Twitter. That is how users’ behavior will be connected to their Twitter profiles. Then an advertiser must choose what conversion event they want users to perform, like purchasing a product by clicking on the checkout. Finally, the advertiser needs to specify how much they are willing to pay when a consumer converts. Then Twitter uses the data from the website tags to choose which customers are the most likely to visit the advertiser’s website and convert. Twitter will show the ad to those people. The advertisers will still have to pay for users who click through, even if they don’t end up converting, but the intention of the program is for Twitter to do a better job at targeting a narrower audience that is more likely to convert. According to Twitter’s statistics, advertisers who have taken advantage of the conversion-only objective have seen 2.5 times more conversions than from ads using the old objective.

Hanif Quentino’s complete Viral Loop 2.0 bonus, in addition to his exclusive review, can be viewed on the following site:
http://emarketingchamps.com/viral-loop-2/

For more information, please visit https://www.facebook.com/Viral-Loop-20-Review-1727836580874817/

Contact Info:
Name: Hanif Quentino
Organization: eMarketingChamps

Video URL: https://www.youtube.com/watch?v=sCoKDSxUmaM

Source: http://marketersmedia.com/recently-launched-viral-loop-2-0-creates-buzz-as-premium-guide-walk-thru-released-by-emarketingchamps/141451

Release ID: 141451

Research Reports Initiated on Energy Stocks Falcon Oil and Gas, Leucrotta Exploration, Renaissance Oil, and Altai Resources

LONDON, UK / ACCESSWIRE / October 27, 2016 / Active Wall St. announces the list of stocks for today’s research reports. Pre-market the Active Wall St. team provides the technical coverage impacting selected stocks trading on the Toronto Exchange and belonging under the Oil & Gas – E&P industry. Companies recently under review include Falcon Oil & Gas, Leucrotta Exploration, Renaissance Oil, and Altai Resources. Get all of our free research reports by signing up at: http://www.activewallst.com/register/.

On Wednesday, October 26, 2016, at the end of trading session, the TSX Venture Composite index ended the day at 775.39, 1.31% lower, on a total volume of 180,742,137 shares.

Additionally, the Energy index was down by 0.78%, ending the session at 206.90.

Active Wall St. has initiated research reports on the following equities: Falcon Oil & Gas Ltd. (TSX-V: FO), Leucrotta Exploration Inc. (TSX-V: LXE), Renaissance Oil Corporation (TSX-V: ROE), and Altai Resources Inc. (TSX-V: ATI). Register with us now for your free membership and research reports at: http://www.activewallst.com/register/.

Falcon Oil & Gas Ltd.

Dublin, Ireland headquartered Falcon Oil & Gas Ltd.’s stock finished Wednesday’s session flat at $0.09 with a total volume of 33,411 shares traded. Shares of Falcon Oil & Gas, which engages in the acquisition, exploration, and development of unconventional and conventional oil and gas assets in Australia, Hungary, South Africa, and Canada, have gained 12.50% in the past one month. The Company’s shares are trading below its 200-day moving average. Falcon Oil & Gas’ 200-day moving average of $0.12 is above its 50-day moving average of $0.09. See our research report on FO.V at: http://www.activewallst.com/registration-3/?symbol=FO.

Leucrotta Exploration Inc.

Calgary, Canada headquartered Leucrotta Exploration Inc.’s stock fell 2.29%, to close the day at $2.13. The stock recorded a trading volume of 1.35 million shares, which was above its three months average volume of 226,168 shares. Shares of Leucrotta Exploration, which engages in the acquisition, development, exploration, and production of oil and natural gas reserves in Canada, have gained 8.12% in the last one month and 12.11% in the past three months. Furthermore, the stock has surged 113.00% in the previous one year. The company’s shares are trading above their 50-day and 200-day moving averages. Moreover, the stock’s 50-day moving average of $2.06 is greater than its 200-day moving average of $1.81. The complimentary research report on LXE.V at: http://www.activewallst.com/registration-3/?symbol=LXE.

Renaissance Oil Corp.

On Wednesday, shares in Vancouver, Canada headquartered Renaissance Oil Corp. ended the session 9.76% lower at $0.19 with a total volume of 808,947 shares traded. Renaissance Oil’s shares have surged 105.56% in the past one year. Shares of the company, which engages in the acquisition and exploration of oil and gas properties, are trading above its 200-day moving average. Furthermore, the stock’s 50-day moving average of $0.25 is greater than its 200-day moving average of $0.18. Register for free and access the latest research report on ROE.V at: http://www.activewallst.com/registration-3/?symbol=ROE.

Altai Resources Inc.

On Wednesday, shares in Toronto, Canada headquartered Altai Resources Inc. recorded a trading volume of 411,333 shares, which was higher than their three months average volume of 309,357 shares. The stock ended the day 7.14% lower at $0.06. Altai Resources’s stock has gained 16.67% in the past one year. Shares of the Company, which operates as a junior natural resource exploration and development company in Canada, are trading above its 50-day and 200-day moving averages of $0.05, respectively. Get free access to your research report on ATI.V at: http://www.activewallst.com/registration-3/?symbol=ATI.

Active Wall Street:

Active Wall Street (AWS) produces regular sponsored and non-sponsored reports, articles, stock market blogs, and popular investment newsletters covering equities listed on NYSE and NASDAQ and micro-cap stocks. AWS has two distinct and independent departments. One department produces non-sponsored analyst certified content generally in the form of press releases, articles and reports covering equities listed on NYSE and NASDAQ and the other produces sponsored content (in most cases not reviewed by a registered analyst), which typically consists of compensated investment newsletters, articles and reports covering listed stocks and micro-caps. Such sponsored content is outside the scope of procedures detailed below.

AWS has not been compensated; directly or indirectly; for producing or publishing this document.

PRESS RELEASE PROCEDURES:

The non-sponsored content contained herein has been prepared by a writer (the “Author”) and is fact checked and reviewed by a third party research service company (the “Reviewer”) represented by a credentialed financial analyst, for further information on analyst credentials, please email info@activewallst.com. Rohit Tuli, a CFA® charterholder (the “Sponsor”), provides necessary guidance in preparing the document templates. The Reviewer has reviewed and revised the content, as necessary, based on publicly available information which is believed to be reliable. Content is researched, written and reviewed on a reasonable-effort basis. The Reviewer has not performed any independent investigations or forensic audits to validate the information herein. The Reviewer has only independently reviewed the information provided by the Author according to the procedures outlined by AWS. AWS is not entitled to veto or interfere in the application of such procedures by the third-party research service company to the articles, documents or reports, as the case may be. Unless otherwise noted, any content outside of this document has no association with the Author or the Reviewer in any way.

NO WARRANTY

AWS, the Author, and the Reviewer are not responsible for any error which may be occasioned at the time of printing of this document or any error, mistake or shortcoming. No liability is accepted whatsoever for any direct, indirect or consequential loss arising from the use of this document. AWS, the Author, and the Reviewer expressly disclaim any fiduciary responsibility or liability for any consequences, financial or otherwise arising from any reliance placed on the information in this document. Additionally, AWS, the Author, and the Reviewer do not (1) guarantee the accuracy, timeliness, completeness or correct sequencing of the information, or (2) warrant any results from use of the information. The included information is subject to change without notice.

NOT AN OFFERING

This document is not intended as an offering, recommendation, or a solicitation of an offer to buy or sell the securities mentioned or discussed, and is to be used for informational purposes only. Please read all associated disclosures and disclaimers in full before investing. Neither AWS nor any party affiliated with us is a registered investment adviser or broker-dealer with any agency or in any jurisdiction whatsoever. To download our report(s), read our disclosures, or for more information, visit http://www.activewallst.com/disclaimer/.

CONTACT

For any questions, inquiries, or comments reach out to us directly. If you’re a company we are covering and wish to no longer feature on our coverage list contact us via email and/or phone between 09:30 EDT to 16:00 EDT from Monday to Friday at:

Email: info@activewallst.com
Phone number: 1-858-257-3144

Office Address: 3rd floor, 207 Regent Street, London, W1B 3HH, United Kingdom

CFA® and Chartered Financial Analyst® are registered trademarks owned by CFA Institute.

SOURCE: Active Wall Street

ReleaseID: 447801

Research Reports Initiated on Silver Stocks Fortuna Silver Mines, MAG Silver, Silver Standard Resources, and Silvercorp Metals

LONDON, UK / ACCESSWIRE / October 27, 2016 / Active Wall St. announces the list of stocks for today’s research reports. Pre-market the Active Wall St. team provides the technical coverage impacting selected stocks trading on the Toronto Exchange and belonging under the Metals & Minerals industry. Companies recently under review include Fortuna Silver Mines, MAG Silver, Silver Standard Resources, and Silvercorp Metals. Get all of our free research reports by signing up at: http://www.activewallst.com/register/.

At the closing bell on Wednesday, October 26, 2016, the Toronto Exchange index edged 0.42% lower to finish the trading session at 14,807.56 on a total volume of 372,738,751 shares exchanging hands for the day.

Active Wall St. has initiated research reports on the following equities: Fortuna Silver Mines Inc. (TSX: FVI), MAG Silver Corporation (TSX: MAG), Silver Standard Resources Inc. (TSX: SSO), and Silvercorp Metals Inc. (TSX: SVM). Register with us now for your free membership and research reports at: http://www.activewallst.com/register/.

Fortuna Silver Mines Inc.

Vancouver, Canada headquartered Fortuna Silver Mines Inc.’s stock dropped 2.14%, to finish Wednesday’s session at $9.13 with a total volume of 456,233 shares traded. Over the last one month, Fortuna Silver Mines’ shares have fallen by 2.67%. However, the stock has rallied 153.61% in the past one year. Shares of the Company, which engages in the exploration, extraction, and processing of mineral properties in Latin America, are trading below its 50-day and 200-day moving averages. Fortuna Silver Mines’ 50-day moving average of $9.51 is above its 200-day moving average of $9.26. See our research report on FVI.TO at: http://www.activewallst.com/registration-3/?symbol=FVI.

MAG Silver Corp.

Vancouver, Canada headquartered MAG Silver Corp.’s stock declined 2.86%, to close the day at $19.35. The stock recorded a trading volume of 139,815 shares. Shares of MAG Silver have fallen by 3.44% in the last one month. However, the stock has surged 96.65% in the previous one year. Shares of the company, which focuses on acquiring, exploring, and development of district scale projects located primarily in the Mexican Silver Belt, are trading above their 200-day moving average. Moreover, the stock’s 50-day moving average of $19.98 is greater than its 200-day moving average of $18.43. The complimentary research report on MAG.TO at: http://www.activewallst.com/registration-3/?symbol=MAG.

Silver Standard Resources Inc.

On Wednesday, shares in Vancouver, Canada-based Silver Standard Resources Inc. ended the session 2.81% lower at $14.55 with a total volume of 442,409 shares traded. Shares of Silver Standard Resources, which engages in the acquisition, exploration, development, and operation of precious metal resource properties in the Americas, have gained 48.32% in the past one year. The stock is trading below its 50-day and 200-day moving averages. Furthermore, the company’s 50-day moving average of $15.55 is greater than its 200-day moving average of $15.01. Register for free and access the latest research report on SSO.TO at: http://www.activewallst.com/registration-3/?symbol=SSO.

Silvercorp Metals Inc.

On Wednesday, shares in Vancouver, Canada headquartered Silvercorp Metals Inc. recorded a trading volume of 384,217 shares. The stock ended the day 3.29% lower at $3.53. Silvercorp Metals’ stock has rallied 236.19% in the past one year. The Company is trading above its 200-day moving average. The stock’s 50-day moving average of $4.02 is above its 200-day moving average of $3.40. Shares of the Company, which together with its subsidiaries, engages in the acquisition, exploration, development, and mining of precious and base metal mineral properties in China, are trading at PE ratio of 67.88. Get free access to your research report on SVM.TO at: http://www.activewallst.com/registration-3/?symbol=SVM.

Active Wall Street:

Active Wall Street (AWS) produces regular sponsored and non-sponsored reports, articles, stock market blogs, and popular investment newsletters covering equities listed on NYSE and NASDAQ and micro-cap stocks. AWS has two distinct and independent departments. One department produces non-sponsored analyst certified content generally in the form of press releases, articles and reports covering equities listed on NYSE and NASDAQ and the other produces sponsored content (in most cases not reviewed by a registered analyst), which typically consists of compensated investment newsletters, articles and reports covering listed stocks and micro-caps. Such sponsored content is outside the scope of procedures detailed below.

AWS has not been compensated; directly or indirectly; for producing or publishing this document.

PRESS RELEASE PROCEDURES:

The non-sponsored content contained herein has been prepared by a writer (the “Author”) and is fact checked and reviewed by a third party research service company (the “Reviewer”) represented by a credentialed financial analyst, for further information on analyst credentials, please email info@activewallst.com. Rohit Tuli, a CFA® charterholder (the “Sponsor”), provides necessary guidance in preparing the document templates. The Reviewer has reviewed and revised the content, as necessary, based on publicly available information which is believed to be reliable. Content is researched, written and reviewed on a reasonable-effort basis. The Reviewer has not performed any independent investigations or forensic audits to validate the information herein. The Reviewer has only independently reviewed the information provided by the Author according to the procedures outlined by AWS. AWS is not entitled to veto or interfere in the application of such procedures by the third-party research service company to the articles, documents or reports, as the case may be. Unless otherwise noted, any content outside of this document has no association with the Author or the Reviewer in any way.

NO WARRANTY

AWS, the Author, and the Reviewer are not responsible for any error which may be occasioned at the time of printing of this document or any error, mistake or shortcoming. No liability is accepted whatsoever for any direct, indirect or consequential loss arising from the use of this document. AWS, the Author, and the Reviewer expressly disclaim any fiduciary responsibility or liability for any consequences, financial or otherwise arising from any reliance placed on the information in this document. Additionally, AWS, the Author, and the Reviewer do not (1) guarantee the accuracy, timeliness, completeness or correct sequencing of the information, or (2) warrant any results from use of the information. The included information is subject to change without notice.

NOT AN OFFERING

This document is not intended as an offering, recommendation, or a solicitation of an offer to buy or sell the securities mentioned or discussed, and is to be used for informational purposes only. Please read all associated disclosures and disclaimers in full before investing. Neither AWS nor any party affiliated with us is a registered investment adviser or broker-dealer with any agency or in any jurisdiction whatsoever. To download our report(s), read our disclosures, or for more information, visit http://www.activewallst.com/disclaimer/.

CONTACT

For any questions, inquiries, or comments reach out to us directly. If you’re a company we are covering and wish to no longer feature on our coverage list contact us via email and/or phone between 09:30 EDT to 16:00 EDT from Monday to Friday at:

Email: info@activewallst.com
Phone number: 1-858-257-3144

Office Address: 3rd floor, 207 Regent Street, London, W1B 3HH, United Kingdom

CFA® and Chartered Financial Analyst® are registered trademarks owned by CFA Institute.

SOURCE: Active Wall Street

ReleaseID: 447800

Blog Coverage Dynavax Releases New Data Showing That its Vaccine HEPLISAV-B Offers Higher Seroprotection Against Hepatitis B

LONDON, UK / ACCESSWIRE / October 27, 2016 / Active Wall St. blog coverage looks at the headline from Dynavax Technologies Corp. (NASDAQ: DVAX). The company announced on October 26, 2016, the results of the pivotal Phase 3 trial of the sub group HBV-23 for its investigational hepatitis B vaccine HEPLISAV-B. The data were presented at the Infectious Diseases Society of America’s (IDSA) annual IDWeek 2016 at New Orleans. Register with us now for your free membership and blog access at: http://www.activewallst.com/register/.

Today, AWS is promoting its blog coverage on DVAX. Get all of our free blog coverage and more by clicking on the link below:

http://www.activewallst.com/registration-3/?symbol=DVAX

The results of the analysis of the sub group HBV-23 confirmed that HEPLISAV-B, stimulated significantly higher seroprotection rates with fewer doses than the currently licensed hepatitis B vaccine Engerix-B®. The analysis compared the results of treatment of patients with hepatitis B using HEPLISAV-B when provided as two doses over the course of a month as compared to Engerix-B, which was administered as three doses over six months.

Commenting on the development, Rob Janssen, M.D., Chief Medical Officer for Dynavax said:

“We were encouraged to see that HEPLISAV-B administered as two doses over one month provided a significantly higher rate of seroprotection in these individuals than the existing hepatitis B vaccine. The lower immunogenicity observed in sub-groups in the Engerix-B arm of this Phase 3 study demonstrates the critical need for a hepatitis B vaccine that can provide higher rates of seroprotection with fewer doses to adequately protect adults against the consequences of this chronic viral infection.”

Results of Phase 3 trial of the sub group HBV-23 (Poster #754)

The total participants for treatment under this group were 8,374 in the age group of 18 – 70 years. The study compared the results of patients who were given two doses of HEPLISAV-B over four weeks with the three doses of Engerix-B over 24 weeks. The sub group was divided in terms of age, sex, BMI, type of diabetes, and smoking status. Overall study results showed a significantly higher seroprotection rate with HEPLISAV-B versus Engerix-B (95.4% at week 24 versus 81.3% at week 28, respectively). The majority difference was identified in participants who were older, had diabetes, high BMI (body mass index), or who smoked.

In patients with diabetes, HEPLISAV-B offered seroprotection in 90% of the participants, whereas Engerix-B offered only 24.9% seroprotection.

In patients with BMI of 30 or more HEPLISAV-B offered seroprotection rate of 94.7% whereas for Engerix-B it was 75.4%.

In patients in the age group of 60 -70 years HEPLISAV-B offered seroprotection at 91.6% whereas for Engerix-B it was 72.6%.

In patients who were smokers HEPLISAV-B offered seroprotection at 95.9% whereas for Engerix-B it was 78.6%.

The adverse effects common to both was the site pain of the injection whereas other adverse effects recorded were fatigue, headache, and malaise.

About HEPLISAV-B

HEPLISAV-B is an investigational adult hepatitis B injectable vaccine which is administered in two doses over one month. The vaccine combines hepatitis B surface antigen with a proprietary Toll-like receptor 9 agonists to enhance the immune response. Dynavax has worldwide commercial rights to HEPLISAV-B. HEPLISAV-B and its Biologics License Application is currently under US Food and Drug Administration (FDA) review. The FDA has established a Prescription Drug User Fee Act (PDUFA) action date of December 15, 2016.

Dynavax had announced in September 2016 that the FDA’s Biologics Evaluation and Research cancelled the scheduled Vaccines and Related Biological Products Advisory Committee (VRBPAC) meeting. The meeting was scheduled for November 16, 2016, to review the Biologics License Application (BLA) for HEPLISAV-B.

About Engerix-B

ENGERIX-B is an injectable vaccine indicated for immunization against infection caused by all known subtypes of hepatitis B virus. It is manufactured by GlaxoSmithKline Biologicals.

What is Hepatitis B?

Hepatitis B is a virus that infects the liver and can go undetected as the symptoms are like that of the common flu. In extreme cases, it can lead to cirrhosis of the liver, hepatocellular carcinoma, and death. The US Centres for Disease Control and Prevention (CDC) stated that around 20,000 people are infected with it annually and currently does not have a cure or any method of disease prevention.

Stock Performance

The new data release helped the stock of Dynavax to jump in the early trading; however at the closing bell, on Wednesday, October 26, 2016, Dynavax Technologies’ stock slightly slipped 0.99% from its previous closing price of $10.15, ending the trading session at $10.05. A total volume of 940.79 thousand shares were traded at the end of the day. The stock currently has a market cap of $398.08 million.

Active Wall Street:

Active Wall Street (AWS) produces regular sponsored and non-sponsored reports, articles, stock market blogs, and popular investment newsletters covering equities listed on NYSE and NASDAQ and micro-cap stocks. AWS has two distinct and independent departments. One department produces non-sponsored analyst certified content generally in the form of press releases, articles and reports covering equities listed on NYSE and NASDAQ and the other produces sponsored content (in most cases not reviewed by a registered analyst), which typically consists of compensated investment newsletters, articles and reports covering listed stocks and micro-caps. Such sponsored content is outside the scope of procedures detailed below.

AWS has not been compensated; directly or indirectly; for producing or publishing this document.

PRESS RELEASE PROCEDURES:

The non-sponsored content contained herein has been prepared by a writer (the “Author”) and is fact checked and reviewed by a third party research service company (the “Reviewer”) represented by a credentialed financial analyst, for further information on analyst credentials, please email info@activewallst.com. Rohit Tuli, a CFA® charterholder (the “Sponsor”), provides necessary guidance in preparing the document templates. The Reviewer has reviewed and revised the content, as necessary, based on publicly available information which is believed to be reliable. Content is researched, written and reviewed on a reasonable-effort basis. The Reviewer has not performed any independent investigations or forensic audits to validate the information herein. The Reviewer has only independently reviewed the information provided by the Author according to the procedures outlined by AWS. AWS is not entitled to veto or interfere in the application of such procedures by the third-party research service company to the articles, documents or reports, as the case may be. Unless otherwise noted, any content outside of this document has no association with the Author or the Reviewer in any way.

NO WARRANTY

AWS, the Author, and the Reviewer are not responsible for any error which may be occasioned at the time of printing of this document or any error, mistake or shortcoming. No liability is accepted whatsoever for any direct, indirect or consequential loss arising from the use of this document. AWS, the Author, and the Reviewer expressly disclaim any fiduciary responsibility or liability for any consequences, financial or otherwise arising from any reliance placed on the information in this document. Additionally, AWS, the Author, and the Reviewer do not (1) guarantee the accuracy, timeliness, completeness or correct sequencing of the information, or (2) warrant any results from use of the information. The included information is subject to change without notice.

NOT AN OFFERING

This document is not intended as an offering, recommendation, or a solicitation of an offer to buy or sell the securities mentioned or discussed, and is to be used for informational purposes only. Please read all associated disclosures and disclaimers in full before investing. Neither AWS nor any party affiliated with us is a registered investment adviser or broker-dealer with any agency or in any jurisdiction whatsoever. To download our report(s), read our disclosures, or for more information, visit http://www.activewallst.com/disclaimer/.

CONTACT

For any questions, inquiries, or comments reach out to us directly. If you’re a company we are covering and wish to no longer feature on our coverage list contact us via email and/or phone between 09:30 EDT to 16:00 EDT from Monday to Friday at:

Email: info@activewallst.com
Phone number: 1-858-257-3144

Office Address: 3rd floor, 207 Regent Street, London, W1B 3HH, United Kingdom

CFA® and Chartered Financial Analyst® are registered trademarks owned by CFA Institute.

SOURCE: Active Wall Street

ReleaseID: 447812

Post Earnings Coverage as Microsoft Beats Topline and Bottomline Estimates

LONDON, UK / ACCESSWIRE / October 27, 2016 / Active Wall St. announces its post-earnings coverage on Microsoft Corp. (NASDAQ: MSFT). The company reported its financial results for the first quarter fiscal 2017 on October 21, 2016. The software giant posted better-than-expected results and top- and bottom-lines grew on y-o-y basis. Register with us now for your free membership at: http://www.activewallst.com/register/.

Today, AWS is promoting its earnings coverage on MSFT. Get our free coverage by signing up to http://www.activewallst.com/registration-3/?symbol=MSFT.

Earnings Reviewed

For the three months ended on September 30th, 2016, Microsoft reported revenue of $20.5 billion, which was higher by 0.4% billion and $22.3 billion on an adjusted basis. The company posted Q1 FY17 operating income of $5.2 billion and $7.1 billion on an adjusted basis. Microsoft posted net income of $4.69 billion, or $0.60 per share, for Q1 FY17 compared to net income of $4.9 billion, or $0.61 per share, in the year ago period. Excluding the impact of revenue deferrals and restructuring charges, adjusted earnings came in at $0.76 per share, which comfortably surpassed analysts’ estimates of $0.68 per share and revenue of $21.7 billion.

Segment Overview

For Microsoft’s Productivity and Business Processes’ revenue grew 6% to $6.7 billion, primarily due to higher revenue from Office 365. Office commercial products and cloud services revenue grew 5% driven by Office 365 commercial revenue growth of 51%. The segment’s Office consumer products and cloud services revenue grew 8% and Office 365 consumer subscribers increased to 24.0 million. Dynamics products and cloud services revenue grew 11% driven by Dynamics online revenue growth revenue increased $352 million or 6%. Office Commercial revenue increased $264 million, or 5%, driven by higher revenue from Office 365 commercial; revenue included an unfavourable foreign currency impact of 3%. Operating income decreased slightly, primarily due to higher operating expenses. Gross margin was flat, reflecting higher cost of revenue, offset by higher revenue. Cost of revenue increased $353 million, or 34%, driven by an increased mix of cloud offerings.

During Q1 FY17, Microsoft’s Intelligent Cloud segment revenue grew $490 million, or 8%, due to higher revenue from server products and cloud services. The segment’s Server products and cloud services revenue grew $486 million, or 11%, driven by Azure revenue growth of 116%, as well as growth in revenue from server products licensed on-premises. Enterprise Services revenue increased 1%, driven by growth in revenue from Premier Support Services and Microsoft Consulting Services, offset in part by a decline in revenue from custom support agreements. Operating income decreased $333 million, or 14%, primarily due to higher operating expenses. Gross margin increased $75 million, or 2%, mainly due to higher revenue, offset in part by higher cost of revenue.

For Q1 FY17, Revenue in Microsoft’s More Personal Computing division declined 2% to $9.3 billion, mainly due to lower revenue from Devices and Gaming, offset in part by higher revenue from Search advertising. Devices revenue decreased $493 million or 27%. Phone revenue decreased $799 million or 72%, driven by a reduction in volume of phones sold. Surface revenue increased $253 million or 38%, primarily driven by a higher mix of premium devices sold.

During Q1 FY17, the Gaming segment revenue decreased $110 million or 5%, primarily due to lower Xbox hardware revenue, offset in part by higher revenue from Xbox software and services. Search advertising revenue increased $409 million or 40%. Search advertising revenue, excluding traffic acquisition costs, increased 9%, primarily driven by growth in Bing, due to higher revenue per search and search volume. Windows revenue increased slightly, mainly due to higher revenue from patent licensing. Windows OEM licensing revenue was flat, slightly ahead of the PC market.

Operating income increased $401 million or 26%, primarily due to lower operating expenses. Gross margin decreased slightly, reflecting lower revenue, offset in part by a reduction in cost of revenue.

Share Repurchase

Microsoft returned $6.6 billion to shareholders in the form of share repurchases and dividends in Q1 FY17. During the reported quarter, the company announced an 8% increase in its quarterly dividend to $0.39 per share, a new share repurchase program authorizing up to $40 billion in share repurchases, and reaffirmed it is on track to complete its current $40 billion share repurchase program by December 31, 2016.

LinkedIn Update

Microsoft expects to close the acquisition of LinkedIn Corporation (NYSE: LNKD). Post-closing of the transaction, the company will report LinkedIn results in the Productivity and Business segment. Microsoft is also expecting to introduce the sale of its entry-level feature phone business in Q2 FY 17, subject to regulatory approvals and other closing conditions.

Outlook

Microsoft did not provided earnings target for the coming quarter; however the company is forecasting sales of $25.05 billion, based on the midpoint of its guidance.

Stock Performance

Microsoft’s share price finished yesterday’s trading session at $60.63, marginally sliding 0.59%. A total volume of 29.91 million shares exchanged hands, which was higher than the 3 months average volume of 24.88 million shares. The stock has advanced 4.62% in the last month, 8.54% in the past three months, and 23.12% in the previous six months. Furthermore, since the start of the year, shares of the company have gained 11.53%. The stock is trading at a PE ratio of 28.84 and has a dividend yield of 2.57%.

Active Wall Street:

Active Wall Street (AWS) produces regular sponsored and non-sponsored reports, articles, stock market blogs, and popular investment newsletters covering equities listed on NYSE and NASDAQ and micro-cap stocks. AWS has two distinct and independent departments. One department produces non-sponsored analyst certified content generally in the form of press releases, articles and reports covering equities listed on NYSE and NASDAQ and the other produces sponsored content (in most cases not reviewed by a registered analyst), which typically consists of compensated investment newsletters, articles and reports covering listed stocks and micro-caps. Such sponsored content is outside the scope of procedures detailed below.

AWS has not been compensated; directly or indirectly; for producing or publishing this document.

PRESS RELEASE PROCEDURES:

The non-sponsored content contained herein has been prepared by a writer (the “Author”) and is fact checked and reviewed by a third party research service company (the “Reviewer”) represented by a credentialed financial analyst, for further information on analyst credentials, please email info@activewallst.com. Rohit Tuli, a CFA® charterholder (the “Sponsor”), provides necessary guidance in preparing the document templates. The Reviewer has reviewed and revised the content, as necessary, based on publicly available information which is believed to be reliable. Content is researched, written and reviewed on a reasonable-effort basis. The Reviewer has not performed any independent investigations or forensic audits to validate the information herein. The Reviewer has only independently reviewed the information provided by the Author according to the procedures outlined by AWS. AWS is not entitled to veto or interfere in the application of such procedures by the third-party research service company to the articles, documents or reports, as the case may be. Unless otherwise noted, any content outside of this document has no association with the Author or the Reviewer in any way.

NO WARRANTY

AWS, the Author, and the Reviewer are not responsible for any error which may be occasioned at the time of printing of this document or any error, mistake or shortcoming. No liability is accepted whatsoever for any direct, indirect or consequential loss arising from the use of this document. AWS, the Author, and the Reviewer expressly disclaim any fiduciary responsibility or liability for any consequences, financial or otherwise arising from any reliance placed on the information in this document. Additionally, AWS, the Author, and the Reviewer do not (1) guarantee the accuracy, timeliness, completeness or correct sequencing of the information, or (2) warrant any results from use of the information. The included information is subject to change without notice.

NOT AN OFFERING

This document is not intended as an offering, recommendation, or a solicitation of an offer to buy or sell the securities mentioned or discussed, and is to be used for informational purposes only. Please read all associated disclosures and disclaimers in full before investing. Neither AWS nor any party affiliated with us is a registered investment adviser or broker-dealer with any agency or in any jurisdiction whatsoever. To download our report(s), read our disclosures, or for more information, visit http://www.activewallst.com/disclaimer/.

CONTACT

For any questions, inquiries, or comments reach out to us directly. If you’re a company we are covering and wish to no longer feature on our coverage list contact us via email and/or phone between 09:30 EDT to 16:00 EDT from Monday to Friday at:

Email: info@activewallst.com
Phone number: 1-858-257-3144

Office Address: 3rd floor, 207 Regent Street, London, W1B 3HH, United Kingdom

CFA® and Chartered Financial Analyst® are registered trademarks owned by CFA Institute.

SOURCE: Active Wall Street

ReleaseID: 447799