Monthly Archives: August 2017

Corporate News Blog – Gladstone Announces Acquisition of Fairhaven Group, Inc. and Gum Drop Cases, LLC

Research Desk Line-up: Intercontinental Exchange Post Earnings Coverage

LONDON, UK / ACCESSWIRE / August 31, 2017 / Pro-Trader Daily takes a look at the latest corporate events and news making the headlines for Gladstone Investment Corp. (NASDAQ: GAIN) (“Gladstone”), following which we have published a free report that can be viewed by signing up at http://protraderdaily.com/optin/?symbol=GAIN. The Company announced on August 28, 2017, that together with the executive management team of Fairhaven, Inc., formed Pioneer Square Brands, Inc., to acquire Fairhaven and Gum Drop Cases, LLC. The investment from Gladstone will provide equity and secured debt to close the transaction. Pioneer Square is a leading designer and marketer of premium mobile technology bags and cases sold primarily to the K-12 education market. Pioneer Square will resume the operation of respective brands of Fairhaven and Gumdrop separately. For immediate access to our complimentary reports, including today’s coverage, register for free now at:

http://protraderdaily.com/register/

Discover more of our free reports coverage from other companies within the Diversified Investments industry. Pro-TD has currently selected Intercontinental Exchange, Inc. (NYSE: ICE) for due-diligence and potential coverage as the Company reported on August 03, 2017, its financial results for Q2 2017. Tune in to our site to register for a free membership, and be among the early birds that get our report on Intercontinental Exchange when we publish it.

At Pro-TD, we make it our mission to bring you news that matter about the stock you follow. Today, our research desk covers a blog story on GAIN; also brushing on ICE. Go directly to your stock of interest and access today’s free coverage at:

http://protraderdaily.com/optin/?symbol=GAIN

http://protraderdaily.com/optin/?symbol=ICE

The Announcement

The Company is a business development entity that seeks to make debt and equity investments in lower middle market businesses with $20 million to $100 million in revenue in the United States in connection with the acquisition, changes in control, and recapitalizations. Gladstone views this partnership with Fairhaven’s management team as a definitive growth strategy on the creation of Pioneer Square. The combination of these two Companies is set to create a clear market leader in mobile device protection in the rapidly growing, K-12 sector, and looks forward to build on the leadership position.

Adjournment of 2017 Annual Meeting

Gladstone had held its 2017 Annual Meeting of Stockholders on August 03, 2017. To solicit additional votes to establish a quorum for the Annual Meeting, the meeting was adjourned till August 24, 2017. During the meeting on August 24, there was the election of two directors, namely, Anthony W. Parker, and Michela A. English. The Board also approved the proposal to authorize the Company to issue and sell shares of common stock at a price below its then current net asset value per share, subject to limitations, that the number of shares issued and sold to such stockholder’s approval does not exceed 25%.

Company Growth Prospects

On August 01, 2017, Gladstone announced its Q1 FY17 results for the quarter ended June 30, 2017. The Company reported exit of one investment in Q1 FY17, which resulted in success fee income of $1.7 million and net cash proceeds of $19 million, including repayment of the debt investment of $13.6 million at par and a realized gain of $1.0 million. The Company announced a merger of one of its portfolio Companies into another one of the portfolio Companies, resulting in success fee income of $0.3 million.

Gladstone also announced issuance of 2.3 million shares of common stock at a public offering price of $9.38 per share resulting in gross proceeds of $21.2 million and net proceeds of $20.1 million in the Q1 FY17.

Gladstone reported net investment incomes of $5.4 million in Q1 FY17 and $5.3 million in Q4 FY16. Net investment income according to the Company, over the period, was relatively flat, as the increase in total investment income, which was primarily due to higher other income offset by an increase in total expenses, net of credits, etc., attributed to higher bad debt expense and lower credits from the Adviser. Net asset value per common share as of June 30, 2017, decreased to $9.88 from $9.95 as of March 31, 2017. The decrease was attributed to the issuance of shares of common stock at a price below the then current net asset value per common share.

Last Close Stock Review

Gladstone Investment’s share price finished yesterday’s trading session at $9.27, slightly advancing 0.11%. A total volume of 66.93 thousand shares have exchanged hands. The Company’s stock price advanced 0.11% in the last three months, 2.20% in the past six months, and 0.98% in the previous twelve months. Additionally, the stock surged 10.29% since the start of the year. Shares of the Company have a PE ratio of 10.00 and have a dividend yield of 8.28%. The stock currently has a market cap of $302.85 million.

Pro-Trader Daily:

Pro-Trader Daily (Pro-TD) produces regular sponsored and non-sponsored reports, articles, stock market blogs, and popular investment newsletters covering equities listed on NYSE and NASDAQ and Canadian stocks. PRO-TD has two distinct and independent departments. One department produces non-sponsored analyst certified content generally in the form of press releases, articles and reports covering equities listed on NYSE and NASDAQ and the other produces sponsored content (in most cases not reviewed by a registered analyst), which typically consists of compensated investment newsletters, articles, and reports covering listed stocks and micro-caps. Such sponsored content is outside the scope of procedures detailed below.

PRO-TD has not been compensated; directly or indirectly; for producing or publishing this document.

PRESS RELEASE PROCEDURES:

The non-sponsored content contained herein has been prepared by a writer (the “Author”) and is fact checked and reviewed by a third party research service company (the “Reviewer”) represented by a credentialed financial analyst [for further information on analyst credentials, please email contact@protraderdaily.com. Rohit Tuli, a CFA® charter holder (the “Sponsor”), provides necessary guidance in preparing the document templates. The Reviewer has reviewed and revised the content, as necessary, based on publicly available information which is believed to be reliable. Content is researched, written and reviewed on a reasonable effort basis. The Reviewer has not performed any independent investigations or forensic audits to validate the information herein. The Reviewer has only independently reviewed the information provided by the Author according to the procedures outlined by PRO-TD. PRO-TD is not entitled to veto or interfere in the application of such procedures by the third-party research service company to the articles, documents or reports, as the case may be. Unless otherwise noted, any content outside of this document has no association with the Author or the Reviewer in any way.

NO WARRANTY

PRO-TD, the Author, and the Reviewer are not responsible for any error which may be occasioned at the time of printing of this document or any error, mistake or shortcoming. No liability is accepted whatsoever for any direct, indirect or consequential loss arising from the use of this document. PRO-TD, the Author, and the Reviewer expressly disclaim any fiduciary responsibility or liability for any consequences, financial or otherwise arising from any reliance placed on the information in this document. Additionally, PRO-TD, the Author, and the Reviewer do not (1) guarantee the accuracy, timeliness, completeness or correct sequencing of the information, or (2) warrant any results from use of the information. The included information is subject to change without notice.

NOT AN OFFERING

This document is not intended as an offering, recommendation, or a solicitation of an offer to buy or sell the securities mentioned or discussed, and is to be used for informational purposes only. Please read all associated disclosures and disclaimers in full before investing. Neither PRO-TD nor any party affiliated with us is a registered investment adviser or broker-dealer with any agency or in any jurisdiction whatsoever. To download our report(s), read our disclosures, or for more information, visit http://protraderdaily.com/disclaimer/.

CONTACT

For any questions, inquiries, or comments reach out to us directly. If you’re a company we are covering and wish to no longer feature on our coverage list contact us via email and/or phone between 09:30 EDT to 16:00 EDT from Monday to Friday at:

Email: contact@protraderdaily.com

Phone number: (917) 341.4653

Office Address: Mainzer Landstrasse 50 Frankfurt am Main, Germany 60325

CFA® and Chartered Financial Analyst® are registered trademarks owned by CFA Institute.

SOURCE: Pro-Trader Daily

ReleaseID: 474291

Factory Automation Market Global Overview, Top Key Players, Growth Analysis and Trends by Forecast to 2022

Factory Automation can be defined as the use of computer aided control devices to operate different industrial processes by replacing human involvement

Pune, India – August 31, 2017 /MarketersMedia/

Market Highlights:
The industry players are emphasized on increasing the efficiency of manufacturing process which is the major driver in Factory Automation Market. Apart from it, developments in computer aided systems, and internet of things (IoT), engineering technologies are the factors driving Factory Automation market. Usage of robots in industrial controller mechanisms has been a market trend. However, the decreasing human labor has led to a threat in factory automation. Lack of awareness and scarcity of investment by many companies could be the major restraints for factory automation.

Factory Automation Market can be defined as the use of computer aided control devices to operate different industrial processes by replacing human involvement. Factory Automation helps to operate multiple processes in controlled manner. It helps for mass production by reducing time and increasing production quality.

Industrial Automation consists of different levels such as sensor level, automation control level automation, supervision level and enterprise level. The sensor level can also be called as the process level that uses sensors and actuators for getting values of the process variables on periodic or continuous basis. Control devices which include PC’s, PLC’s and DCS are used by the automation companies at control level. PLC is majorly a machine control whereas DCS leads the process control. The automation control level operates using different embedded processors, PID algorithms to control all processes. Factory Automation includes various technologies as supervisory control and data acquisition (SCADA), human machine interface (HMI).

Request a Sample Report @ https://www.marketresearchfuture.com/sample_request/3565

Major Key Players:
• Siemens AG
• ABB Ltd
• Emerson Electric Corporation
• Rockwell Automation
• Honeywell International Inc.
• Schneider Electric
• Rexroth Bosch Group
• Mitsubishi Electric Corporation
• Yokogawa Electric Corporation
• Omron Corporation

Regional Analysis:
The regional analysis of Factory Automation market is being studied for region such as Asia pacific, North America, Europe and Rest of the World. The ongoing global trend towards Factory Automation is being reflected in an increase in the number of industrial robots in the U.S. market.

Currently, there has been news in Japan that Factory Automation has paved a way for establishment of robot training centers. There has been an upward trend in Factory Automation in the Asia pacific nations including Vietnam. It is proved that using industrial robots helps saving time and increasing product quality and production capacity leading to improve the competitiveness.

Factory Automation Market Segmentation:
The Factory Automation Market has been segmented on the basis of type, technology, and end user. By type, the market is been classified into fixed automation, programmable automation, flexible automation, and integrated automation. By technology, the Factory Automation market is categorized into supervisory control and data acquisition (SCADA), programmable automation controller (PAC), programmable logic controller (PLC), distributed control system (DCS), and human machine interface (HMI). By end-user, the market is sub-segmented into manufacturing, automotive, packaging & processing, energy & power, semiconductor & electronics, printing & converting and others.

Market Research Analysis:
Regional analysis for Factory Automation Market is studied in different geographic regions as Americas, Europe, Asia-Pacific and Rest of world. North America is the leading region among Europe, Asia-Pacific and Middle East & Africa. Asia-Pacific is the fastest growing region which is estimated to show high growth during forecast period.

Increasing technology adoption and government initiatives to increase domestic manufacturing and production is expected to drive the growth of Factory Automation market in the region. However, high installation cost of automation solutions in the market is one of the major reason behind slow growth in the region.

Factory Automation Market (MRFR) Research Analysis:
Market research future has segmented the Factory Automation market on the basis of end-users into manufacturing, automotive, packaging & processing, energy & power, semiconductor & electronics and printing industry. These industries are deploying automation solution in order to increase their production frequency without compromising with quality. Geographically, manufacturing and automotive are expected to dominate the market.

Factory Automation market by type is been classified into fixed automation, programmable automation, flexible automation and integrated automation. Fixed automation is projected to dominate the market during forecast period due to its various advantages which include automated material handling, low unit cost, and high production rate followed by programmable automation. Whereas, integrated automation is expected to be the fastest growing type due to growing market of advanced process automation system.

Intended Audience:
• Process Automation and Instrumentation Manufacturers
• Industrial Robot Manufacturers
• MES (Manufacturing Execution System) and MOM (Manufacturing Operations Management) Players
• System Integrators
• Government Organizations
• Research/Consultancy firms

Access Report Details @ https://www.marketresearchfuture.com/reports/factory-automation-market-3565

Table of Contents
1 Executive Summary
2 Market Dynamics
2.1 Market Drivers
2.2 Market Inhibitors
2.3 Factory Automation System Integration
2.4 Porter’s Five Forces Analysis
Continued….

List of Tables
Table 1 Global Factory Automation Market, By Type, 2016-2022 (Usd Billion)
Table 2 Global Fixed Automation In Factory Automation Market (Usd Billion)
Continued….

List of Figures
Figure 1 Global Factory Automation Market: Drivers & Restraint
Figure 2 Global Factory Automation System Integration
Continued….

About Market Research Future:
At Market Research Future (MRFR), we enable our customers to unravel the complexity of various industries through our Cooked Research Report (CRR), Half-Cooked Research Reports (HCRR), Raw Research Reports (3R), Continuous-Feed Research (CFR), and Market Research & Consulting Services.

MRFR team have supreme objective to provide the optimum quality market research and intelligence services to our clients. Our market research studies by products, services, technologies, applications, end users, and market players for global, regional, and country level market segments, enable our clients to see more, know more, and do more, which help to answer all their most important questions.

Contact Info:
Name: Akash Anand
Email: akash.anand@marketresearchfuture.com
Organization: Market Research Future
Address: Market Research Future Office No. 524/528,
Phone: +1 646 845 9312

Source URL: https://marketersmedia.com/factory-automation-market-global-overview-top-key-players-growth-analysis-and-trends-by-forecast-to-2022/232665

For more information, please visit https://www.marketresearchfuture.com/reports/factory-automation-market-3565

Source: MarketersMedia

Release ID: 232665

Lighthouse Translations and Interpretations Joins the International Convention and Conference Association

Lighthouse Translations and Interpretations has joined the ICCA to take advantage of global networking opportunities, and introduce their simultaneous interpretation services to more people in more countries than ever.

Lighthouse Translations and Interpretations Joins the International Convention and Conference Association

Miami, United States – August 31, 2017 /MarketersMedia/

Lighthouse Translations joined this month the International Convention and Conference Association (ICCA) to introduce its services to more companies and worldwide associations than ever before. The company, which provides simultaneous interpretation services, interpretation equipment rental and document translations, will now be able to expand its support to thousands of groups across the world.

Lighthouse offers document translation, simultaneous interpretation, conference interpreting, and simultaneous interpretation equipment. Their high-quality services go far beyond most interpretation services, taking into account not just the words, but also body language, tone, cultural conventions and more, to ensure that the interpretation is as faithful to the speaker’s intent as possible.

Their new membership of the ICCA will enable them to offer their services to international associations around the globe, for meetings, conferences and day-to-day business meetings. ICCA offers associations a broad range of member benefits, while suppliers like Lighthouse can guide associations as to the benefits of providing simultaneous interpretation services and having more of their materials translated into attendees’ native languages.

This membership is part of a strategic expansion at Lighthouse Translations, which is already a member of the American Translators Association, the Greater Miami Convention and Visitors Bureau, Meet Puerto Rico, ASONAHORES (Dom. Rep.) and several other DMC and MICE (Meetings, Incentives, Conferences and Exhibitions) organizations. Lighthouse Translations boasts high profile clients like Microsoft, HP and Kellogg’s, to name a few. With clients primarily in the US and Latin America, the company now looks to strengthen its presence in the Americas and cross continents with ICCA.

A spokesperson for Lighthouse Translations explained, “We are delighted to have been accepted as a member of the ICCA. This new affiliation will further expand our business. We are already a successful translation business with a global profile in the private business sector, but associations offer us the opportunity to broaden the scope of our service provision, while bridging gaps in quality and service for the associations themselves. We are excited about what this will represent for our business, and for the many international associations who belong to ICCA that now have an additional top-tier language service provider among its ranks. We are on hand to offer superior interpretation and translation services at competitive rates to associations of all sizes.”

About Lighthouse Translations: Lighthouse Translations offers high-quality, reliable and professional document translation, interpretation services, interpretation equipment rental and subtitling services for most languages, supporting businesses of all sizes, across the world. With more than 25 years of combined management experience, their experienced translators and interpreters serve a myriad of specialized industries including health care organizations, pharmaceutical companies, tech firms, universities, international associations and global marketing firms. The company has offices in Miami, Puerto Rico and Dominican Republic, and has local presence through strategic partners in all major US East Coast cities as well as in Latin America, including Brazil, Colombia, Panama and Mexico. For more information please visit: https://lighthouseonline.com/

Contact Info:
Name: Rafael Morel
Email: info@lighthouseonline.com
Organization: Lighthouse Translations and Interpretations
Address: 3399 NW 72nd Ave Miami FL 33122
Phone: 1-305-420-6878

Video URL: https://www.youtube.com/watch?v=LvQIo5XQaFI

Source URL: https://marketersmedia.com/lighthouse-translations-and-interpretations-joins-the-international-convention-and-conference-association/234996

For more information, please visit https://lighthouseonline.com

Source: MarketersMedia

Release ID: 234996

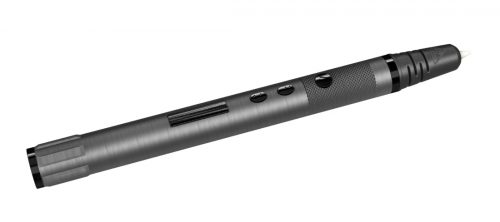
MYNT3D Introduces the Smallest Metal 3D Pen in the World

Up and coming manufacturers and distributors of 3D Printing Pens have recently completed the design of an all-new product that is certain to rewrite history.

MYNT3D Introduces the Smallest Metal 3D Pen in the World

Soquel, California, United States – August 31, 2017 /MarketersMedia/

MYNT3D is a company that sells and manufactures 3D Printing Pens that are exclusively available for the enthusiasts of the modern day wonder that is the 3D printing technology. The business was established in January 2016 and has ever since offered a diverse range of 3d printing pen and similar products

In recent news, it has been revealed that the company has successfully been able to complete the design of an all-new product: the Metal 3D Pen. Being renowned as the world’s smallest product of its kind, this new pen is certain to send shockwaves across the market and gain widespread attention in no time.

With the help of this new pen, users can sketch, print, & doodle amazing three-dimensional masterpieces and get considerable precision. The stylus also has adjustable feed which helps regulate speed & flow for optimal control of material while drawing. What’s more, the product comes equipped with a kit that includes slim, ergonomic touch stylus, 3 colors of ABS plastic filament plus A/C adapter.

Although the 3D Printing Pen niche may seem new to many, the category is filled with big name players. However, MYNT3D is one name that firmly stands apart. The company’s products differ from the competition due to the fact that they take standard 1.75mm 3D printer plastic instead of proprietary filament.

During a brief interview about the company’s products, the spokesperson of MYNT3D elaborated further on the point by stating, “Our pen also has speed and temperature controls and can be used with a variety of different materials instead of only ABS or PLA with competitors products.” Moreover, the team at MYNT3D has also revealed that they use a different type of gear box that is stronger and more robust than the planetary gear box in competitors pens. All in all, it is safe to say that the company stands out from the competition and brings something unique to the table.

About the Company

MYNT3D is a manufacturer and distributor of 3D printing pens. Based in Soquel, California, the company was established in 2016.

Contact Info:
Name: Ryley Lyon
Email: media@mynt3d.com
Organization: MYNT3D

Source URL: https://marketersmedia.com/mynt3d-introduces-the-smallest-metal-3d-pen-in-the-world/234635

For more information, please visit https://www.mynt3d.com/

Source: MarketersMedia

Release ID: 234635

Fish Oil Market 2017 Global Industry Sales, Supply, Consumption, Analysis and Forecasts to 2022

Wiseguyreports.Com Publish New Market Research Report On-“Fish Oil Market 2017 Global Industry Sales, Supply, Consumption, Analysis and Forecasts to 2022”.

Pune, India – August 31, 2017 /MarketersMedia/

Fish Oil Market 2017

Executive Summary
Global Fish Oil market competition by top manufacturers, with production, price, revenue (value) and market share for each manufacturer; the top players including
TripleNine Group
COPEINCA
Austevoll Seafood ASA
China Fishery Group
FF Skagen A/S
Pesquera Diamante S.A.
Camanchaca
OLVEA Fish Oils
Omega Protein Corporation
Pesquera Pacific Star
Orizon SA
Oceana Group
Pioneer Fishing
Kobyalar Group
CV. Sari LautJaya
Animalfeeds International
Nissui Group
Havsbrún
Eskja
HB Grandi
United Marine Products

Request a Sample Report @ https://www.wiseguyreports.com/sample-request/959282-global-fish-oil-market-research-report-2017

Geographically, this report is segmented into several key Regions, with production, consumption, revenue (million USD), market share and growth rate of Fish Oil in these regions, from 2012 to 2022 (forecast), covering
North America
Europe
China
Japan
Southeast Asia
India

On the basis of product, this report displays the production, revenue, price, market share and growth rate of each type, primarily split into
Feed Grade
Health food grade
Pharmaceutical grade
Other

On the basis on the end users/applications, this report focuses on the status and outlook for major applications/end users, consumption (sales), market share and growth rate of Fish Oil for each application, including
Aquaculture
Direct Human Consumption
Others (Hydrogenation and Industrial)

Complete Report Details @ https://www.wiseguyreports.com/reports/959282-global-fish-oil-market-research-report-2017

Table of Contents – Key Points Analysis

1 Fish Oil Market Overview
2 Global Fish Oil Market Competition by Manufacturers
3 Global Fish Oil Capacity, Production, Revenue (Value) by Region (2012-17)
4 Global Fish Oil Supply (Production), Consumption, Export, Import by Region (2012-2017)
5 Global Fish Oil Production, Revenue (Value), Price Trend by Type
6 Global Fish Oil Market Analysis by Application

7 Global Fish Oil Manufacturers Profiles/Analysis
7.1 TripleNine Group
7.1.1 Company Basic Information, Manufacturing Base, Sales Area and Its Competitors
7.1.2 Fish Oil Product Category, Application and Specification
7.1.2.1 Product A
7.1.2.2 Product B
7.1.3 TripleNine Group Fish Oil Capacity, Production, Revenue, Price and Gross Margin (2012-2017)
7.1.4 Main Business/Business Overview
7.2 COPEINCA
7.2.1 Company Basic Information, Manufacturing Base, Sales Area and Its Competitors
7.2.2 Fish Oil Product Category, Application and Specification
7.2.2.1 Product A
7.2.2.2 Product B
7.2.3 COPEINCA Fish Oil Capacity, Production, Revenue, Price and Gross Margin (2012-2017)
7.2.4 Main Business/Business Overview
7.3 Austevoll Seafood ASA
7.3.1 Company Basic Information, Manufacturing Base, Sales Area and Its Competitors
7.3.2 Fish Oil Product Category, Application and Specification
7.3.2.1 Product A
7.3.2.2 Product B
7.3.3 Austevoll Seafood ASA Fish Oil Capacity, Production, Revenue, Price and Gross Margin (2012-2017)
7.3.4 Main Business/Business Overview
7.4 China Fishery Group
7.4.1 Company Basic Information, Manufacturing Base, Sales Area and Its Competitors
7.4.2 Fish Oil Product Category, Application and Specification
7.4.2.1 Product A
7.4.2.2 Product B
..…..Continued

Buy Now @ https://www.wiseguyreports.com/checkout?currency=one_user-USD&report_id=959282

Contact Info:
Name: Norah Trent
Email: sales@wiseguyreports.com
Organization: WiseGuy Research Consultants Pvt. Ltd.
Address: Office No. 528, Amanora Chambers Magarpatta Road, Hadapsar Pune – 411028 Maharashtra, India
Phone: +1-646-845-9349

Source URL: https://marketersmedia.com/fish-oil-market-2017-global-industry-sales-supply-consumption-analysis-and-forecasts-to-2022/235127

For more information, please visit http://www.wiseguyreports.com

Source: MarketersMedia

Release ID: 235127

Automotive Usage-Based Insurance Market 2017 Global Share, Trend, Segmentation and Forecast to 2021

The analysts forecast the global automotive usage-based insurance market to grow at a CAGR of 7.93% during the period 2017-2021.

Pune, India – August 31, 2017 /MarketersMedia/

Global Automotive Usage-Based Insurance Market

Description

WiseGuyReports.Com adds” Global Automotive Usage-Based Insurance Market 2017-2021 “Research To Its Database.

The global automotive UBI market is at a nascent stage and has low penetration in the overall automotive insurance market. The market is seeing an influx of new players owing to its growth potential and the emergence of smartphone app technology in automotive UBI. The competition is expected to intensify during the forecast period because of product extensions and technological innovations. Many international players are expected to grow organically during the forecast period by expanding their customer base and creating differentiated products through partnerships with insurance companies.

The analysts forecast the global automotive usage-based insurance market to grow at a CAGR of 7.93% during the period 2017-2021.

Covered in this report 
The report covers the present scenario and the growth prospects of the global automotive usage-based insurance market for 2017-2021. To calculate the market size, the report presents the vendor landscape and a corresponding detailed analysis of the top four vendors in the market.

 
Get sample Report @  https://www.wiseguyreports.com/sample-request/872270-global-automotive-usage-based-insurance-market-2017-2021

 
The market is divided into the following segments based on geography: 
• APAC 
• Europe 
• North America

The Global Automotive Usage-Based Insurance Market 2017-2021, has been prepared based on an in-depth market analysis with inputs from industry experts. The report covers the market landscape and its growth prospects over the coming years. The report also includes a discussion of the key vendors operating in this market.

Key vendors 
• Intelligent Mechatronic System 
• Octo Telematics 
• Hubio 
• Sierra Wireless 

Other prominent vendors 
• Baseline Telematics 
• Masternaut 
• TomTom Telematics

Market driver 
• Government initiatives encouraging use of telematics. 
• For a full, detailed list, view our report

Market challenge 
• Maintenance of data accuracy for optimum UBI scores. 
• For a full, detailed list, view our report

Market trend 
• Shared data plans to reduce number of data subscriptions per user. 
• For a full, detailed list, view our report

Key questions answered in this report 
• What will the market size be in 2021 and what will the growth rate be? 
• What are the key market trends? 
• What is driving this market? 
• What are the challenges to market growth? 
• Who are the key vendors in this market space? 
• What are the market opportunities and threats faced by the key vendors? 
• What are the strengths and weaknesses of the key vendors?

Report Details @ https://www.wiseguyreports.com/reports/872270-global-automotive-usage-based-insurance-market-2017-2021

 
Table of Contents -Major Key Points

 
PART 01: Executive summary 

PART 02: Scope of the report 

PART 03: Market research methodology 

PART 04: Introduction 
• Key market highlights 
• Overview: Automotive digital insurance through telematics 
• Automotive UBI: Market dynamics 
• Value chain analysis 

PART 05: Market landscape 
• Market overview 
• Working of automotive UBI 
• Market size and forecast 
• Five forces analysis 

PART 06: Market segmentation by UBI type 

PART 07: Geographical segmentation 
• Segmentation of automotive UBI market by geography 
• Automotive UBI market in Europe 
• Automotive UBI market in North America 
• Automotive UBI market in APAC 

PART 08: Market drivers 

PART 09: Market challenges 
• Maintenance of data accuracy for optimum UBI scores 
• Potential for information security breach 
• Operational issues pertaining to UBI 
• Lack of standardization in telematics industry 

PART 10: Market trends 

PART 11: Vendor landscape 
• Competitive benchmarking 
• Other prominent vendors 

PART 12: Key vendor analysis 
• Intelligent Mechatronic System (IMS) 
• Octo Telematics 
• Hubio 
• Sierra Wireless 

………..CONTINUED

 
Buy Now@ https://www.wiseguyreports.com/checkout?currency=one_user-USD&report_id=872270

Contact Info:
Name: Norah Trent
Email: Sales@wiseguyreports.com
Organization: WiseGuy Research Consultants Pvt. Ltd.
Address: Office No. 528, Amanora Chambers Magarpatta Road, Hadapsar Pune – 411028 Maharashtra, India
Phone: +1-646-845-9349

Source URL: https://marketersmedia.com/automotive-usage-based-insurance-market-2017-global-share-trend-segmentation-and-forecast-to-2021/235129

For more information, please visit https://www.wiseguyreports.com

Source: MarketersMedia

Release ID: 235129

Super Slow Motion Cameras Global Market Share, Size, Trend and Growth 2017-2022

Wiseguyreports.Com Publish New Market Research Report On-“Super Slow Motion Cameras Global Market Share, Size, Trend and Growth 2017-2022”.

Pune, India – August 31, 2017 /MarketersMedia/

Super Slow Motion Cameras Market 2017

Executive Summary
This report studies Super Slow Motion Cameras in Global market, especially in North America, China, Europe, Southeast Asia, Japan and India, with production, revenue, consumption, import and export in these regions, from 2012 to 2016, and forecast to 2022.

This report focuses on top manufacturers in global market, with production, price, revenue and market share for each manufacturer, covering
Gopro
Sony
AEE
Panasonic
Sioeye
Eastman Kodak
OKAA
Canon
Blackvue
Papago
Philips
DOD
GARMIN

Request a Sample Report @ https://www.wiseguyreports.com/sample-request/2050174-global-super-slow-motion-cameras-market-professional-survey-report-2017

By types, the market can be split into
Type I
Type II

By Application, the market can be split into
Military
Aerospace
Automotive
Research
Entertainment Industries

By Regions, this report covers (we can add the regions/countries as you want)
North America
China
Europe
Southeast Asia
Japan
India

Complete Report Details @ https://www.wiseguyreports.com/reports/2050174-global-super-slow-motion-cameras-market-professional-survey-report-2017

Table of Contents – Key Points Analysis

1 Industry Overview of Super Slow Motion Cameras
2 Manufacturing Cost Structure Analysis of Super Slow Motion Cameras
3 Technical Data and Manufacturing Plants Analysis of Super Slow Motion Cameras
4 Global Super Slow Motion Cameras Overall Market Overview
5 Super Slow Motion Cameras Regional Market Analysis
6 Global 2012-2017E Super Slow Motion Cameras Segment Market Analysis (by Type)
7 Global 2012-2017E Super Slow Motion Cameras Segment Market Analysis (by Application)

8 Major Manufacturers Analysis of Super Slow Motion Cameras
8.1 Gopro
8.1.1 Company Profile
8.1.2 Product Picture and Specifications
8.1.2.1 Product A
8.1.2.2 Product B
8.1.3 Gopro 2016 Super Slow Motion Cameras Sales, Ex-factory Price, Revenue, Gross Margin Analysis
8.1.4 Gopro 2016 Super Slow Motion Cameras Business Region Distribution Analysis
8.2 Sony
8.2.1 Company Profile
8.2.2 Product Picture and Specifications
8.2.2.1 Product A
8.2.2.2 Product B
8.2.3 Sony 2016 Super Slow Motion Cameras Sales, Ex-factory Price, Revenue, Gross Margin Analysis
8.2.4 Sony 2016 Super Slow Motion Cameras Business Region Distribution Analysis
8.3 AEE
8.3.1 Company Profile
8.3.2 Product Picture and Specifications
8.3.2.1 Product A
8.3.2.2 Product B
8.3.3 AEE 2016 Super Slow Motion Cameras Sales, Ex-factory Price, Revenue, Gross Margin Analysis
8.3.4 AEE 2016 Super Slow Motion Cameras Business Region Distribution Analysis
8.4 Panasonic
8.4.1 Company Profile
8.4.2 Product Picture and Specifications
8.4.2.1 Product A
8.4.2.2 Product B
8.4.3 Panasonic 2016 Super Slow Motion Cameras Sales, Ex-factory Price, Revenue, Gross Margin Analysis
8.4.4 Panasonic 2016 Super Slow Motion Cameras Business Region Distribution Analysis
8.5 Sioeye
8.5.1 Company Profile
8.5.2 Product Picture and Specifications
8.5.2.1 Product A
8.5.2.2 Product B
..…..Continued

Buy Now @ https://www.wiseguyreports.com/checkout?currency=one_user-USD&report_id=2050174

Contact Info:
Name: Norah Trent
Email: sales@wiseguyreports.com
Organization: WiseGuy Research Consultants Pvt. Ltd.
Address: Office No. 528, Amanora Chambers Magarpatta Road, Hadapsar Pune – 411028 Maharashtra, India
Phone: +1-646-845-9349

Source URL: https://marketersmedia.com/super-slow-motion-cameras-global-market-share-size-trend-and-growth-2017-2022/235131

For more information, please visit http://www.wiseguyreports.com

Source: MarketersMedia

Release ID: 235131

Automotive Cyber Security 2017 Global Market to reach $ 4957.34 M USD with 75.44 % CAGR Forecast to 2024

WiseGuyReports.com adds “Automotive Cyber Security 2017 Global Market to reach $ 4957.34 M USD with 75.44 % CAGR Forecast to 2024 ” reports to its Database.

Pune, India – August 31, 2017 /MarketersMedia/

Automotive Cyber Security SWOT Analysis and Forecast 2024

This report studies the global Automotive Cyber Security market, analyzes and researches the Automotive Cyber Security development status and forecast in United States, EU, Japan, China, India and Southeast Asia. In this report, the global Automotive Cyber Security market is valued at USD 55.22 million in 2016 and is expected to reach USD 4957.34 million by the end of 2024, growing at a CAGR of 75.44% between 2016 and 2024.

This report focuses on the top players in global market, like
Arilou technologies
Cisco systems
Harman (TowerSec)
SBD Automotive & Ncc Group
Argus
BT Security
Intel Corporation
ESCRYPT Embedded Systems
NXP Semiconductors
Trillium
Secunet AG
Security Innovation
Symphony Teleca & Guardtime
Utimaco GmbH
Other

Request For Sample Report @ https://www.wiseguyreports.com/sample-request/1002394-global-automotive-cyber-security-market-research-report-2017

Market segment by Regions/Countries, this report covers
United States
EU
Japan
China
India
Southeast Asia

Market segment by Type, Automotive Cyber Security can be split into
Software-based
Hardware-based
Network & Cloud
Security Services & Frameworks

Market segment by Application, Automotive Cyber Security can be split into
Passenger Cars
Commercial Vehicles

 Complete Report Details @ https://www.wiseguyreports.com/reports/1002394-global-automotive-cyber-security-market-research-report-2017

Table Of Contents

1 Industry Overview 1
1.1 Automotive Cyber Security Market Overview 1
1.1.1 Automotive Cyber Security Product Scope 1
1.1.2 Market Status and Outlook 1
1.2 Global Automotive Cyber Security Market Size and Analysis by Regions 2
1.2.1 United States 4
1.2.2 EU 5
1.2.3 Japan 6
1.2.4 China 7
1.2.5 India 8
1.2.6 Southeast Asia 9
1.3 Automotive Cyber Security Market by Type 9
1.3.1 Software-based 11
1.3.2 Hardware-based 11
1.3.3 Network & Cloud 12
1.3.4 Security Services & Frameworks 13
1.4 Automotive Cyber Security Market by End Users/Application 13
1.4.1 Passenger Cars 14
1.4.2 Commercial Vehicles 15
2 Global Automotive Cyber Security Competition Analysis by Players 17
2.1 Automotive Cyber Security Market Size (Value) by Players (2016-2017) 17
2.2 Competitive Status and Trend 20
3 Company (Top Players) Profiles 22
3.1 Arilou Technologies 22
3.1.1 Company Profile 22
3.1.2 Main Business/Business Overview 22
3.1.3 Products, Services and Solutions 23
3.1.4 Automotive Cyber Security Revenue (Value) (2015-2017) 23
3.2 Cisco Systems 25
3.2.1 Company Profile 25
3.2.2 Main Business/Business Overview 25
3.2.3 Products, Services and Solutions 26
3.2.4 Automotive Cyber Security Revenue (Value) (2015-2017) 26
3.3 Harman (Towersec) 28
3.3.1 Company Profile 28
3.3.2 Main Business/Business Overview 28
3.3.3 Products, Services and Solutions 29
3.3.4 Automotive Cyber Security Revenue (Value) (2015-2017) 30
3.4 SBD Automotive & Ncc Group 31
3.4.1 Company Profile 31
3.4.2 Main Business/Business Overview 32
3.4.3 Products, Services and Solutions 32
3.4.4 Automotive Cyber Security Revenue (Value) (2015-2017) 33
3.5 Argus Cyber Security 35
3.5.1 Company Profile 35
3.5.2 Main Business/Business Overview 35
3.5.3 Products, Services and Solutions 35
3.5.4 Automotive Cyber Security Revenue (Value) (2015-2017) 36
3.6 BT Security 38
3.6.1 Company Profile 38
3.6.2 Main Business/Business Overview 38
3.6.3 Products, Services and Solutions 39
3.6.4 Automotive Cyber Security Revenue (Value) (2015-2017) 40
3.7 Intel Corporation 41
3.7.1 Company Profile 41
3.7.2 Main Business/Business Overview 42
3.7.3 Products, Services and Solutions 42
3.7.4 Automotive Cyber Security Revenue (Value) (2015-2017) 43
3.8 Escrypt Embedded Systems 44
3.8.1 Company Profile 44
3.8.2 Main Business/Business Overview 45
3.8.3 Products, Services and Solutions 45
3.8.4 Automotive Cyber Security Revenue (Value) (2015-2017) 46
3.9 NXP Semiconductors 47
3.9.1 Company Profile 47
3.9.2 Main Business/Business Overview 48
3.9.3 Products, Services and Solutions 48
3.9.4 Automotive Cyber Security Revenue (Value) (2015-2017) 49
3.10 Trillium 50
3.10.1 Company Profile 50
3.10.2 Main Business/Business Overview 51
3.10.3 Products, Services and Solutions 51
3.10.4 Automotive Cyber Security Revenue (Value) (2015-2017) 51
3.11 Secunet AG 53
3.11.1 Company Profile 53
3.11.2 Main Business/Business Overview 53
3.11.3 Products, Services and Solutions 53
3.11.4 Automotive Cyber Security Revenue (Value) (2015-2017) 54
3.12 Security Innovation 55
3.12.1 Company Profile 55
3.12.2 Main Business/Business Overview 56
3.12.3 Products, Services and Solutions 56
3.12.4 Automotive Cyber Security Revenue (Value) (2015-2017) 56
3.13 Symphony Teleca & Guardtime 58
3.13.1 Company Profile 58
3.13.2 Main Business/Business Overview 58
3.13.3 Products, Services and Solutions 59
3.13.4 Automotive Cyber Security Revenue (Value) (2015-2017) 60
3.14 Utimaco GmbH 61
3.14.1 Company Profile 61
3.14.2 Main Business/Business Overview 62
3.14.3 Products, Services and Solutions 62
3.14.4 Automotive Cyber Security Revenue (Value) (2015-2017) 63
4 Global Automotive Cyber Security Market Size by Type and Application (2015-2020) 65
4.1 Global Automotive Cyber Security Market Size by Type (2015-2020) 65
4.2 Global Automotive Cyber Security Market Size by Application (2015-2020) 67
4.3 Top Consumer / End Users of Automotive Cyber Security 69
5 United States Automotive Cyber Security Development Status and Outlook 70
5.1 United States Automotive Cyber Security Market Size (2015-2020) 70
5.2 United States Automotive Cyber Security Market Size and Market Share by Players (2016-2017) 70

Continued…….

Buy This Report @ https://www.wiseguyreports.com/checkout?currency=one_user-USD&report_id=1002394

CONTACT US:

Contact Info:
Name: Norah Trent
Organization: WiseGuy Research Consultants Pvt. Ltd.
Address: Office No. 528/524, Amanora Chambers, Magarpatta Road, Hadapsar Pune, Maharashtra 411028
Phone: +1 339 368 6938

Source URL: https://marketersmedia.com/automotive-cyber-security-2017-global-market-to-reach-4957-34-m-usd-with-75-44-cagr-forecast-to-2024/235134

For more information, please visit http://www.wiseguyreports.com

Source: MarketersMedia

Release ID: 235134

Insurance Technology Market Forecast by Status, Scope, Application, Dynamics and Development Status and Outlook 2017-2022

ReportsWeb.com added “Global Insurance Technology Market Size, Status and Forecast 2022” to its vast collection of research Database. The report is spread across 102 pages and supported by 12 company leaders.

August 31, 2017 /MarketersMedia/

The Global Insurance Technology Market Size, Status and Forecast 2022 is a professional and in-depth study on the current state of the Insurance Technology industry. In a word, This report studies Insurance Technology in Global market, especially United States, EU, Japan, China, India and Southeast Asia, focuses on top manufacturers in global market, with capacity, production, price, revenue and market share for each manufacturer. Key companies included in this research are Xchanging plc, Insurance Technology Services, Patriot Technology Solutions, Sky Insurance Technologies, TIA Technology, Seibels, DXC Technology, Marias Technology, Inc, msg life ag, Hubio, Ventiv and Majesco.

Browse complete report @ http://www.reportsweb.com/global-insurance-technology-market-size-status-and-forecast-2022

Market Segment by Region, this report splits Global into several key Region, with sales, revenue, market share and growth rate of Insurance Technology in these regions, from 2011 to 2022 (forecast), like United States, EU, Japan, China, India and Southeast Asia.

->Market segment by Type, Insurance Technology can be split into
1 Auto Insurance
2 Health Insurance
3 Life Insurance
4 Others

Request for Sample @ http://www.reportsweb.com/inquiry&RW00011027601/sample

Major points from Table of Contents:

1 Industry Overview of Insurance Technology

2 Global Insurance Technology Competition Analysis by Players

3 Company (Top Players) Profiles

4 Global Insurance Technology Market Size by Type and Application (2012-2017)
4.1 Global Insurance Technology Market Size by Type (2012-2017)
4.2 Global Insurance Technology Market Size by Application (2012-2017)
4.3 Potential Application of Insurance Technology in Future
4.4 Top Consumer/End Users of Insurance Technology

5 United States Insurance Technology Development Status and Outlook
5.1 United States Insurance Technology Market Size (2012-2017)
5.2 United States Insurance Technology Market Size and Market Share by Players (2016 and 2017)

6 EU Insurance Technology Development Status and Outlook
6.1 EU Insurance Technology Market Size (2012-2017)
6.2 EU Insurance Technology Market Size and Market Share by Players (2016 and 2017)

7 Japan Insurance Technology Development Status and Outlook

8 China Insurance Technology Development Status and Outlook

9 India Insurance Technology Development Status and Outlook

10 Southeast Asia Insurance Technology Development Status and Outlook

11 Market Forecast by Regions, Type and Application (2017-2022)

12 Insurance Technology Market Dynamics

13 Market Effect Factors Analysis
13.1 Technology Progress/Risk
13.1.1 Substitutes
13.1.2 Technology Progress in Related Industry
13.2 Consumer Needs Trend/Customer Preference
13.3 External Environmental Change
13.3.1 Economic Fluctuations
13.3.2 Other Risk Factors
List of Tables and Figures
Figure Insurance Technology Product Scope
Figure Global Insurance Technology Market Size (Million USD) (2012-2017)
Table Global Insurance Technology Market Size (Million USD) and Growth Rate by Regions (2012-2017)
Figure Global Insurance Technology Market Share by Regions in 2016
Figure United States Insurance Technology Market Size (Million USD) and Growth Rate by Regions (2012-2017)
Figure EU Insurance Technology Market Size (Million USD) and Growth Rate by Regions (2012-2017)
Figure Japan Insurance Technology Market Size (Million USD) and Growth Rate by Regions (2012-2017)
Figure China Insurance Technology Market Size (Million USD) and Growth Rate by Regions (2012-2017)
Figure India Insurance Technology Market Size (Million USD) and Growth Rate by Regions (2012-2017)
Figure Southeast Asia Insurance Technology Market Size (Million USD) and Growth Rate by Regions (2012-2017)
Figure Global Insurance Technology Market Share by Application in 2016
Figure Insurance Technology Market Size (Million USD) and Growth Rate in Auto Insurance (2012-2017)
Figure Insurance Technology Market Size (Million USD) and Growth Rate in Health Insurance (2012-2017)
Figure Insurance Technology Market Size (Million USD) and Growth Rate in Life Insurance (2012-2017)
Figure Insurance Technology Market Size (Million USD) and Growth Rate in Others (2012-2017)
Table Insurance Technology Market Size (Million USD) by Players (2016 and 2017)
Figure Insurance Technology Market Size Share by Players in 2016
Figure Insurance Technology Market Size Share by Players in 2017
Table Xchanging plc Basic Information List
Table Insurance Technology Business Revenue (Million USD) of Xchanging plc (2012-2017)
Figure Xchanging plc Insurance Technology Business Revenue Market Share in 2016
Table Insurance Technology Services Basic Information List
Table Insurance Technology Business Revenue (Million USD) of Insurance Technology Services (2012-2017)
Figure Insurance Technology Services Insurance Technology Business Revenue Market Share in 2016
Table Patriot Technology Solutions Basic Information List
Table Insurance Technology Business Revenue (Million USD) of Patriot Technology Solutions (2012-2017)
Figure Patriot Technology Solutions Insurance Technology Business Revenue Market Share in 2016
Table Sky Insurance Technologies Basic Information List
Table Insurance Technology Business Revenue (Million USD) of Sky Insurance Technologies (2012-2017)
Figure Sky Insurance Technologies Insurance Technology Business Revenue Market Share in 2016
Table TIA Technology Basic Information List

Place a Direct Purchase Order of Complete Report @ http://www.reportsweb.com/buy&RW00011027601/buy/3300

Contact Info:
Name: Sameer Joshi
Email: sales@reportsweb.com
Organization: ReportsWeb
Phone: +1-646-491-9876

Source URL: https://marketersmedia.com/insurance-technology-market-forecast-by-status-scope-application-dynamics-and-development-status-and-outlook-2017-2022/235144

For more information, please visit http://www.reportsweb.com/global-insurance-technology-market-size-status-and-forecast-2022

Source: MarketersMedia

Release ID: 235144

Internet of Things platforms Market Products, Services and Solutions, Recent Developments and Business Overview 2017-2022

ReportsWeb.com added “Global Internet of Things platforms Market Size, Status and Forecast 2022” to its vast collection of research Database. The report is spread across 107 pages and supported by 16 company leaders.

August 31, 2017 /MarketersMedia/

The Global Internet of Things platforms Market Size, Status and Forecast 2022 is a professional and in-depth study on the current state of the Internet of Things platforms industry. In a word, This report studies Internet of Things platforms in Global market, especially United States, EU, Japan, China, India and Southeast Asia, focuses on top manufacturers in global market, with capacity, production, price, revenue and market share for each manufacturer. Key companies included in this research are 2lemetry (Amazon), Abo Data, Alcatel-Lucent (Mformation), Amazon, Arrayent, AT&T, Autodesk (Seecontrol), Avanquest, Ayla Networks, Bosch Software Innovations, Carriots, Comarch, Concirrus, Cumulocity, Davra Networks and Device Insight.

Browse complete report @ http://www.reportsweb.com/global-internet-of-things-platforms-market-size-status-and-forecast-2022

Market Segment by Region, this report splits Global into several key Region, with sales, revenue, market share and growth rate of Internet of Things platforms in these regions, from 2011 to 2022 (forecast), like United States, EU, Japan, China, India and Southeast Asia.

->Market segment by Type, Internet of Things platforms can be split into
1 Energy
2 Medical Care
3 Building
4 E – Commerce
5 Other

Request for Sample @ http://www.reportsweb.com/inquiry&RW00011027602/sample

Major points from Table of Contents:

1 Industry Overview of Internet of Things platforms

2 Global Internet of Things platforms Competition Analysis by Players

3 Company (Top Players) Profiles

4 Global Internet of Things platforms Market Size by Type and Application (2012-2017)
4.1 Global Internet of Things platforms Market Size by Type (2012-2017)
4.2 Global Internet of Things platforms Market Size by Application (2012-2017)
4.3 Potential Application of Internet of Things platforms in Future
4.4 Top Consumer/End Users of Internet of Things platforms

5 United States Internet of Things platforms Development Status and Outlook
5.1 United States Internet of Things platforms Market Size (2012-2017)
5.2 United States Internet of Things platforms Market Size and Market Share by Players (2016 and 2017)

6 EU Internet of Things platforms Development Status and Outlook
6.1 EU Internet of Things platforms Market Size (2012-2017)
6.2 EU Internet of Things platforms Market Size and Market Share by Players (2016 and 2017)

7 Japan Internet of Things platforms Development Status and Outlook

8 China Internet of Things platforms Development Status and Outlook

9 India Internet of Things platforms Development Status and Outlook

10 Southeast Asia Internet of Things platforms Development Status and Outlook

11 Market Forecast by Regions, Type and Application (2017-2022)

12 Internet of Things platforms Market Dynamics

13 Market Effect Factors Analysis
13.1 Technology Progress/Risk
13.1.1 Substitutes
13.1.2 Technology Progress in Related Industry
13.2 Consumer Needs Trend/Customer Preference
13.3 External Environmental Change
13.3.1 Economic Fluctuations
13.3.2 Other Risk Factors
List of Tables and Figures
Figure Internet of Things (IoT) platforms Product Scope
Figure Global Internet of Things (IoT) platforms Market Size (Million USD) (2012-2017)
Table Global Internet of Things (IoT) platforms Market Size (Million USD) and Growth Rate by Regions (2012-2017)
Figure Global Internet of Things (IoT) platforms Market Share by Regions in 2016
Figure United States Internet of Things (IoT) platforms Market Size (Million USD) and Growth Rate by Regions (2012-2017)
Figure EU Internet of Things (IoT) platforms Market Size (Million USD) and Growth Rate by Regions (2012-2017)
Figure Japan Internet of Things (IoT) platforms Market Size (Million USD) and Growth Rate by Regions (2012-2017)
Figure China Internet of Things (IoT) platforms Market Size (Million USD) and Growth Rate by Regions (2012-2017)
Figure India Internet of Things (IoT) platforms Market Size (Million USD) and Growth Rate by Regions (2012-2017)
Figure Southeast Asia Internet of Things (IoT) platforms Market Size (Million USD) and Growth Rate by Regions (2012-2017)
Figure Global Internet of Things (IoT) platforms Market Share by Application in 2016
Figure Internet of Things (IoT) platforms Market Size (Million USD) and Growth Rate in Energy (2012-2017)
Figure Internet of Things (IoT) platforms Market Size (Million USD) and Growth Rate in Medical Care (2012-2017)
Figure Internet of Things (IoT) platforms Market Size (Million USD) and Growth Rate in Building (2012-2017)
Figure Internet of Things (IoT) platforms Market Size (Million USD) and Growth Rate in E – Commerce (2012-2017)
Figure Internet of Things (IoT) platforms Market Size (Million USD) and Growth Rate in Other (2012-2017)
Table Internet of Things (IoT) platforms Market Size (Million USD) by Players (2016 and 2017)
Figure Internet of Things (IoT) platforms Market Size Share by Players in 2016
Figure Internet of Things (IoT) platforms Market Size Share by Players in 2017
Table 2lemetry (Amazon) Basic Information List
Table Internet of Things (IoT) platforms Business Revenue (Million USD) of 2lemetry (Amazon) (2012-2017)
Figure 2lemetry (Amazon) Internet of Things (IoT) platforms Business Revenue Market Share in 2016
Table Abo Data Basic Information List
Table Internet of Things (IoT) platforms Business Revenue (Million USD) of Abo Data (2012-2017)
Figure Abo Data Internet of Things (IoT) platforms Business Revenue Market Share in 2016
Table Alcatel-Lucent (Mformation) Basic Information List
Table Internet of Things (IoT) platforms Business Revenue (Million USD) of Alcatel-Lucent (Mformation) (2012-2017)
Figure Alcatel-Lucent (Mformation) Internet of Things (IoT) platforms Business Revenue Market Share in 2016
Table Amazon Basic Information List
Table Internet of Things (IoT) platforms Business Revenue (Million USD) of Amazon (2012-2017)
Figure Amazon Internet of Things (IoT) platforms Business Revenue Market Share in 2016
Table Arrayent Basic Information List

Place a Direct Purchase Order of Complete Report @ http://www.reportsweb.com/buy&RW00011027602/buy/3300

Contact Info:
Name: Sameer Joshi
Email: sales@reportsweb.com
Organization: ReportsWeb
Phone: +1-646-491-9876

Source URL: https://marketersmedia.com/internet-of-things-platforms-market-products-services-and-solutions-recent-developments-and-business-overview-2017-2022/235147

For more information, please visit http://www.reportsweb.com/global-internet-of-things-platforms-market-size-status-and-forecast-2022

Source: MarketersMedia

Release ID: 235147