Monthly Archives: January 2019

The AMA Alliance Presents ”The Opioid Epidemic: Empowering Community Action,” A Collaboration With ITN Productions

CHICAGO, IL / ACCESSWIRE / January 31, 2019 / Opioid misuse has claimed far too many lives in the United States. Recognizing this national health epidemic, the American Medical Association Alliance (AMAA), in collaboration with the American Medical Association (AMA), is deeply focused on educating physician families and our communities about how to help end the epidemic. To that end, the AMAA and ITN Productions have produced a news-style series of videos designed to raise awareness about effective practices employed by individuals and communities to alleviate the epidemic.

”The Opioid Epidemic: Empowering Community Action” highlights the commitment of government agencies, nonprofits, universities, corporations and the AMA Alliance community to find solutions to address the epidemic. These include enhancing comprehensive treatment and support for substance use disorders, training to tackle the epidemic and public education to end the stigma and misperceptions associated with substance use disorders. Watch the video series https://amaalliance.org/the-opioid-epidemic/

Drawing upon ITN’s 60 years of expertise in storytelling, ”The Opioid Epidemic: Empowering Community Action” features interviews, news items and editorial profiles of leaders and key organizations, spotlighting research about effective methods to combat the opioid epidemic. It also highlights the work being done every day in communities across the United States to assist those with substance use disorders. The series includes several reports:

A report from the AMA Alliance Annual Meeting about the group’s national initiative to educate physician families and communities about how they can help to combat the epidemic
A feature on the role of emergency nurses as first-line responders to help alleviate the opioid epidemic at the ground level and in local communities, led by the Emergency Nurses Association
A visit to the Texas A&M Health Science Center, which is implementing programs to reduce stigma and opioid misuse, as well as training student ambassadors who are future medical professionals, to properly administer opioid overdose reversal medications
An exclusive interview with Dr. Patrice Harris, AMA President-elect and Chair of the AMA’s Opioid Task Force, about task force recommendations and the involvement of local communities to find solutions for the nationwide opioid epidemic

For more information or to watch the video series, visit www.amaalliance.org.

ABOUT THE AMA ALLIANCE

In 1922, the AMA Alliance was established to support physician families and provide grassroots advocacy for the AMA’s health and wellness initiatives, a strong relationship which continues today. As the nation’s largest organization representing physician families, the AMA Alliance’s mission is to build healthier communities by connecting physician families and collaborating to educate and advocate. For more information visit: www.amaalliance.org.

ABOUT ITN PRODUCTIONS

Internationally known news producer ITN is the UK’s leading producer of independent broadcast news. Industry News, a division of ITN, creates unique, issue specific news-style programming for non-profit organizations to develop constructive, accurate and positive storytelling about important issues, sectors and professions. For more information visit: www.itnproductions.com.

For more information, press only:

ITN Productions, Mitch Johnson, VP Content Development, (703) 615-6506, mitch.johnson@itnproductions.com

SOURCE: ITN Productions

ReleaseID: 534099

F & M Bank Corp. Announces Earnings & Dividend

TIMBERVILLE, VA / ACCESSWIRE / January 31, 2019 / F & M Bank Corp. (OTCQX: FMBM), parent company of Farmers & Merchants Bank, announces its financial results for the fourth quarter and year ending December 31, 2018.

Selected highlights for the quarter and year to date include:

Net income of $2.9 million and $9.1 million, respectively;

Non-performing assets dropped $4.65 million or 26.90% during the fourth quarter;

Net interest margin rose to 4.68%;

Loans held for investment increased $21.8 million YTD;

Return on Average Assets of 1.48% and 1.19%, respectively.

Mark Hanna, President, commented “We are pleased to announce fourth quarter and year to date earnings of $2.9 million and $9.1 million, respectively. The fourth quarter results represent a record for quarterly earnings which was driven by an increasing net interest margin. Our margin increased due to our asset sensitive balance sheet which resulted in a $2.6 million increase in interest income and a $935 thousand increase in interest expense. Loans held for investment increased $21.8 million or 3.54% versus the prior year. Deposit growth also accelerated in the second half of the year to $22.1 million or 3.89%.”

Hanna continued, “During the fourth quarter we made significant progress in addressing our problem assets. Previously we had announced that two large loans were placed on non-accrual during the second quarter, resulting in our significant allowance for loan loss funding in the first half of the year. During the fourth quarter we were successful in collecting on one of these loans and we recognized a partial write-down on the other based on the appraised value and continued payment delinquency. As a result of these and other collection efforts our problem assets decreased from $17.3 million to $12.6 million.” Highlights of our financial performance are included below.

Hanna stated, “On January 23rd our Board of Directors declared a fourth quarter dividend of $.25 per share to common shareholders. Based on our most recent trade price of $30.30 per share this constitutes a 3.30% yield on an annualized basis. The dividend will be paid on February 15, 2019, to shareholders of record as of February 1, 2019.”

F & M Bank Corp. is an independent, locally-owned, financial holding company, offering a full range of financial services, through its subsidiary, Farmers & Merchants Bank’s thirteen banking offices in Rockingham, Shenandoah, Page and Augusta Counties, Virginia. The Bank also provides additional services through a loan production office located in Penn Laird, VA and through its subsidiaries, VBS Mortgage, LLC (DBA F&M Mortgage) and VSTitle, LLC located in Harrisonburg, VA. Additional information may be found by contacting us on the internet at www.fmbankva.com or by calling (540) 896-8941.

This press release may contain “forward-looking statements” as defined by federal securities laws, which may involve significant risks and uncertainties. These statements address issues that involve risks, uncertainties, estimates and assumptions made by management, and actual results could differ materially from the results contemplated by these forward-looking statements. Factors that could have a material adverse effect on our operations and future prospects include, but are not limited to, changes in: interest rates, general economic conditions, legislative and regulatory policies, and a variety of other matters. Other risk factors are detailed from time to time in our Securities and Exchange Commission filings. Readers should consider these risks and uncertainties in evaluating forward-looking statements and should not place undue reliance on such statements. We undertake no obligation to update these statements following the date of this press release.

F&M Bank Corp.
Key Statistics

2018

2017

Q4

Q3

Q2

Q1

YTD

YTD

Net
Income (000’s)

$
2,910

$
2,515

$
1,687

$
1,973

$
9,085

$
9,010

Net
Income available to Common

$
2,807

$
2,412

$
1,583

$
1,870

$
8,672

$
8,595

Earnings per common share

$
0.87

$
0.75

$
0.49

$
0.57

$
2.68

$
2.63

Return on Average Assets

1.48
%

1.29
%

0.91
%

1.11
%

1.19
%

1.62
%

Return on Average Equity

12.51
%

10.82
%

7.38
%

8.75
%

9.89
%

13.34
%

Dividend Payout Ratio exclude Special Dividend

28.83
%

33.33
%

51.37
%

43.53
%

37.34
%

26.25
%

Dividend Payout Ratio with Special Dividend

78.35
%

44.81
%

Net
Interest Margin

4.68
%

4.56
%

4.64
%

4.78
%

4.65
%

4.47
%

Yield
on Average Earning Assets

5.50
%

5.30
%

5.29
%

5.38
%

5.35
%

5.05
%

Yield
on Average Interest Bearing Liabilities

1.14
%

1.04
%

0.94
%

0.87
%

1.00
%

0.82
%

Net
Interest Spread

4.36
%

4.26
%

4.35
%

4.51
%

4.35
%

4.23
%

Provision for Loan Losses (000’s)

$
450

$
450

$
1,350

$
680

$
2,930

$

Net
Charge-offs

$
2,483

$
283

$
660

$
309

$
3,735

$
1,499

Net
Charge-offs as a % of Loans

1.55
%

0.18
%

0.42
%

0.20
%

0.58
%

0.24
%

Non-Performing Loans (000’s)

$
10,205

$
15,240

$
14,977

$
7,730

$
10,205

$
4,870

Non-Performing Loans to Total Assets

1.31
%

1.96
%

1.94
%

1.06
%

1.31
%

0.65
%

Non-Performing Assets (000’s)

$
12,648

$
17,303

$
17,011

$
9,758

$
12,648

$
7,004

Non-Performing Assets to Assets

1.62
%

2.23
%

2.21
%

1.34
%

1.62
%

0.94
%

Efficiency Ratio

65.06
%

66.71
%

65.80
%

66.52
%

65.50
%

63.01
%

(1)

The net interest margin is calculated by dividing tax equivalent net interest income by total average earning assets. Tax equivalent interest income is calculated by grossing up interest income for the amounts that are nontaxable (i.e. municipal securities and loan income) then subtracting interest expense. The tax rate utilized is 21%. The Company’s net interest margin is a common measure used by the financial service industry to determine how profitable earning assets are funded. Because the Company earns nontaxable interest income from municipal loans and securities, net interest income for the ratio is calculated on a tax equivalent basis as described above.

(2)

The efficiency ratio is not a measurement under accounting principles generally accepted in the United States. The efficiency ratio is a common measure used by the financial service industry to determine operating efficiency. It is calculated by dividing non-interest expense by the sum of tax equivalent net interest income and non-interest income excluding gains and losses on the investment portfolio. The Company calculates this ratio in order to evaluate how efficiently it utilizes its operating structure to create income. An increase in the ratio from period to period indicates the Company is losing a greater percentage of its income to expenses.

F & M Bank Corp.
Financial Highlights

For Twelve Months Ended December 31,

INCOME STATEMENT

Unaudited
2018

Audited
2017

Interest and Dividend Income

$
36,707,958

$
34,095,349

Interest Expense

4,832,063

3,896,889

Net
Interest Income

31,875,895

30,198,460

Gross
Security Gains (Losses)

(41,914
)

Non-Interest Income

8,003,003

7,934,620

Provision for Loan Losses

2,930,000

Other
Non-Interest Expenses

26,743,762

24,719,017

Income Before Income Taxes

10,205,136

13,372,149

Provision for Income Taxes

1,110,169

4,330,404

Less
Minority Interest income

10,050

31,461

Net
Income

$
9,084,917

$
9,010,284

Dividend on preferred stock

413,191

415,331

Net
Income available to common shareholders

$
8,671,726

$
8,594,953

Average Common Shares Outstanding

3,238,177

3,269,713

Net
Income Per Common Share

2.68

2.63

Dividends Declared

1.20

.94

BALANCE SHEET

Unaudited
December 31,
2018

Audited
December 31,
2017

Cash
and Due from Banks

$
9,521,741

$
10,622,352

Interest Bearing Bank Deposits

1,390,181

1,284,351

Federal Funds Sold

Loans
Held for Sale

55,909,812

39,774,515

Loans
Held for Investment

638,798,885

616,974,067

Less
Allowance for Loan Losses

(5,239,699
)

(6,044,365
)

Net
Loans Held for Investment

633,559,186

610,929,702

Securities

21,843,918

41,242,965

Other
Assets

58,028,442

49,416,495

Total
Assets

$
780,253,280

$
753,270,380

Deposits

$
591,325,319

$
569,176,519

Short
Term Debt

40,116,000

25,296,000

Long
Term Debt

40,218,073

49,732,532

Other
Liabilities

16,682,537

17,790,459

Total
Liabilities

688,341,929

661,995,510

Stockholders’ Equity

91,911,351

91,274,870

Total
Liabilities and Stockholders’ Equity

$
780,253,280

$
753,270,380

Book
Value Per Common Share

$
26.84

$
25.73

Tangible Book Value Per Common Share

$
26.91

$
25.64

CONTACT:

Neil Hayslett, EVP/Chief Operating Officer
540-896-8941
NHayslett@FMBankVA.com

SOURCE: F&M Bank Corp

ReleaseID: 534051

Highmark Interactive Adds Dr. Frederick Carrick, Known for His Work Treating the Brain Injuries of Olympic and Professional Athletes Such As Sidney Crosby and Others, to The Medical Advisory Board

Dr. Carrick sees massive potential in gamified neurological testing

TORONTO, ON / ACCESSWIRE / January 31, 2019 / Highmark Interactive, a leader in digital concussion and mental health technology, today announced that it has added Dr. Frederick Carrick, a worldwide leader in chiropractic neurology and the founder of the Carrick Institute of clinical neuroscience and rehabilitation to it’s Medical Advisory Board.

Dr. Carrick has an extensive network of multidisciplinary health care professionals that have been trained in clinical neuroscience and brain injury. He brings decades of experience with concussion and traumatic brain injury to Highmark’s Medical Advisory Board.

“The EQ system represents a validated instrument that serves as an interactive game that collects data on brain function and health. Playing video games on smartphones and tablets is one of the most popular activities realized today. A game that measures brain function when patients play anywhere they want without having to come to the Doctor’s office is now a reality. EQ is something that we have been dreaming and talking about for many years and now we have it!” said Dr. Frederick Carrick.

Dr. Carrick founded the Carrick Institute that maintains extension facilities across North America, Europe and Oceania. He has spent decades developing novel treatments and attending high profile professional athletes that have suffered a traumatic brain injury. He is referenced by many, including Pittsburgh Penguins star Sidney Crosby for their successful recovery from concussion symptoms.

“The opportunity to work with Dr. Carrick is an incredibly exciting one for Highmark Interactive,” said Dr. Sanjeev Sharma, Executive Chairman of Highmark Interactive. “Dr. Carrick has always had an innovative approach to brain injury, and his interest in, EQ, our gamified testing solution shows that we are leading the next generation of testing and management solutions.”

Highmark Interactive’s EQ™ application is the world’s first mobile-focused, engaging, neurological testing and concussion management tool. The application, available on iOS and Google Play stores, uses engaging games to drive a new, ongoing approach to testing and to examine six different metrics associated with concussions and traumatic brain injuries such as balance, reaction time, executive function and more.

About Dr. Frederick Carrick:

Prof Carrick is a Professor of Neurology and Senior Research Fellow at the Bedfordshire Centre for Mental Health Research in association with the University of Cambridge, UK. He has attended high profile professionals, Olympians and collegiate athletes from around the globe that have suffered brain injury for over 4 decades. His work has been featured on Prime Time Television and in major journals and newspapers. He has developed novel treatment paradigms that have been incorporated in the daily practice of health care practitioners around the world. He is a graduate of CMCC in Toronto and is board certified in neurology with fellowship certification in Traumatic Brain Injury, Vestibular Rehabilitation and EEG. He has a PhD degree from Walden University and his dissertation focused on the Neurophysiological Implications in Learning. He holds a Master of Science degree in Health Professions Education from the Harvard Macy/MGH Institutes and was a global clinical scholar at Harvard Medical School. He serves as the Dean of Education at the Carrick Institute and his published research is indexed in PubMed/US National Library of Medicine/National Institutes of Health.

For more information on Dr. Frederick Carrick, please visit https://carrickinstitute.com/

About Highmark Interactive:

Highmark Interactive is a Toronto based medical technology company with a focus on concussions and other traumatic brain injuries and diseases. Founded in 2017, Highmark uses engaging, mobile-focused games that test a variety of neurologic functions to facilitate ongoing testing and a more accurate clinical assessment.

For any media enquiries, please contact John Gardiner (COO of Highmark Interactive) – john@highmark.tech

For more information on Highmark Interactive, please visit http://highmark.tech or follow @HighmarkInt

SOURCE: Highmark Health

ReleaseID: 534061

Global Etoposide Market by Top Industry Profiles Like Shyndec Pharmaceutical, Qilu Antibiotics, Gansu Fuzheng, KPC Pharmaceuticals and more…

Etoposide Market: This research report categorizes the global Etoposide market by players, region, type, applications. This report also studies the global market status, competition landscape, market share, growth rate, future trends, market drivers, opportunities and challenges, sales channels, distributors and Porter’s Five Forces Analysis.

DUBLIN, United States – January 31, 2019 /MarketersMedia/

Global Etoposide Market report provide in-depth overview of global industry with Major application, types and business players like Shyndec Pharmaceutical, Qilu Antibiotics, Gansu Fuzheng, KPC Pharmaceuticals and more. The Etoposide Market report provides detailed profile assessments and current scenario revenue projections for the most promising industry participants. The Global EtoposideIndustry report focuses on the latest trends in the Global and regional spaces on all the significant components with forecast 2025, including the capacity, cost, price, technology, supplies, production, profit, and competition.

Get Exclusive Sample of Report on Etoposide Market having 118 pages, profiling more than TOP 5 Market Players and supported with tables and figures is available at
https://www.inforgrowth.com/samplerequest/r/33584/global-etoposide-market-insights-forecast-to-2

Following Top Companies are mentioned in this Etoposide Market Report:
Shyndec Pharmaceutical, Qilu Antibiotics, Gansu Fuzheng, KPC Pharmaceuticals, China Resources Double Crane Pharmaceutical, Nippon Kayaku, Accord Healthcare, Teva Pharmaceuticals, Mylan etc.

Global Etoposide Market Research Report 2019 include all basic information related to the global Industry and forecast till 2025. The Etoposide Market research report serves as a repository of analysis and information for every aspect of the market, including regional markets, technology, types, and applications. The objectives of this study are to define, segment, and project the size of the market based on company, product type, end user and key regions.

Market Segmentation:
This report also studies critical parameters of Point of Etoposide Market like Industry Chain, Raw Materials, Cost, Technology, Consumer Preference, Industry Overall (including but not limited to History, Development & Trend, Market Competition, Trade Overview, Policy, Region, Regional Market, Production Development, Sales, and more

On the basis of product, this report displays the production, revenue, price, market share and growth rate of each type, primarily split into
Etoposide for Injection, Etoposide for Oral Use

On the basis of the end users/applications, this Etoposide Market report focuses on the status and outlook for major applications/end users,
Small Cell Lung Cancer, Testicular Cancer

The Etoposide Market Report Covers Following Regions: North America, Europe, Asia-Pacific, South America, Middle East & Africa

Request For Special Discount UP TO 50%:
https://www.inforgrowth.com/samplerequest/r/33584/global-etoposide-market-insights-forecast-to-2

Research methodology of Etoposide Market:

Research study on the Etoposide Market was performed in five phases which include Secondary research, Primary research, subject matter expert advice, quality check and final review. This report focuses on the global Etoposide status, future forecast, growth opportunity, key market and key players. The study objectives are to present the Etoposide development in United States, Europe and China.

Table of Content

1 Industry Overview

1.1 Etoposide Industry

1.1.1 Overview
2 Etoposide Market by Type

2.1 By Type

2.1.1 ELISA Sets
3 Global Etoposide Market Demand

3.1 Segment Overview

3.1.1 Immunology

3.1.2 Inflammation
.
.
.
5 Major Companies List

And more…

View Complete Report with Table of Content:
https://www.inforgrowth.com/r/33584/global-etoposide-market-insights-forecast-to-2

Contact Info:
Name: Rohan
Email: Send Email
Organization: InForGrowth
Address: 6400 Village Pkwy suite # 104, Dublin, CA 94568, USA
Phone: +1-909-329-2808
Website: https://www.inforgrowth.com/

Source URL: https://marketersmedia.com/global-etoposide-market-by-top-industry-profiles-like-shyndec-pharmaceutical-qilu-antibiotics-gansu-fuzheng-kpc-pharmaceuticals-and-more/477947

Source: MarketersMedia

Release ID: 477947

LockinU Unites More Than 1,000 Universities All Around the World, Solving the Issue of Global Young Talents’ Job Search

NEW YORK, NY / ACCESSWIRE / January 31, 2019 / Recently, the career development platform for overseas talents, Lockin China, has officially deployed its business to the global job market and launched its international version, LockinU, as the business focus is to provide excellent talent resources for worldwide employers.

LockinU is positioned as the global young talents career development platform, and its Chinese version of Lockin China was established in 2015, and mainly provided worldwide talent recruitment services for the Chinese employers. With the development of increased business and the gradually matured model, Lockin officially launched its human resources platform for overseas companies and introduced young talents for global enterprises.

At present, LockinU has more than 800,000 registers globally, and has established official partnerships with more than 1,300 universities around the world; the number of registered companies is over 30,000 and the total number of job postings is over 150,000 which has become an important part and indispensable requirement for overseas talents job search.

Major Products & Campus Recruitment Project Experiences

According to the precise talent data from over 1,300 worldwide universities, Lockin pioneered in the GTMD (Global Talents Map Database) instead of the traditional one-way recruiting model’s recruitment system. Through the official partnership with the universities, GTMD will bring large number of worldwide fresh graduates and current students into the database, and target those fresh graduates and current students at the fastest rate. Based on the calculations from the big data, according to the employer’s demand, the target talents are customized, and each customer’s world talent map is personalized to accurately locate and target the focused group and achieve efficiency during the recruiting services.

Over the years, the team, LockinU, has accumulated abundance of campus recruitment project experiences, serviced customers include Baidu, Alibaba, DiDi, IBM, Microsoft, Amazon, Tesla, Apple, Starbucks, Audi, BMW, Disney, HP, PWC, Ernst & Young, etc. University’s On-Campus Recruitment projects have landed at Oxford University, Cambridge University, Harvard University, Stanford University, University of California-Berkeley, University of Chicago, Northwestern University, Imperial College London, University College London, the University of Sydney, University of Melbourne, ESADE Barcelona Business School, Technical University of Berlin, and many other top leading global universities.

Main Events

During the collaborations with many overseas universities, Lockin has fully understood that job hunting for college graduates is an important topic for schools all around the world. In 2015, LockinU co-founded GUCCU (The Global University China Career Union) with more than 200 universities including the University of Adelaide, the University of Liverpool, University of Birmingham, University of Warwick and Northeastern University. The objective is to apply a variety of channels to explore and practice in constructing a path which can be used for college graduates at worldwide workplaces.

Each year Lockin co-hosts the GUCDC (Global University Career Development Conference) along with GUCCU; with the sharing of expertise from the industry, integration of academic research from leading universities and the latest practical experiences from well-known corporations all over the world to better address the demands of career development for those global young talents.

Every fall, LockinU and GUCCU collaborate together in hosting a global campus recruitment event – “80 Days Event for Global Young Talents”, presenting pre-work program workshops at global universities, invited human resources industry experts explaining the employment market situations, career planning, resumes writing, interviewing and other related job searching techniques. Every year, events have been held at hundreds of world famous universities, for examples, University of California-Berkeley, Northwestern university, Johns Hopkins University, University of Minnesota, Oxford University, Imperial College London, University of Warwick, University College London, Australian National University, the University of Melbourne, Monash University, and etc. In addition to the workshops, the “80 Days Event for Global Young Talents” also recommended tens of thousands of positions from global enterprises to students, accurately connecting employers and candidates, and solving the needs of both parties.

Nowadays, many well-known international companies are engaged in deep collaboration with Lockin due to the emergence of Lockin solving the shortage problem of high quality talent sources for global enterprises, and building a high-speed bridge for global talents without any boundaries. With the development of LockinU and the maturity of the GTMD database, it has fundamentally opened up the limitations of global young talents’ development, as a result, those distinctive talents are not only limited to the local market, but extend to the world’s most needed regions and promote the world economy as a whole.

Wei.Ge@lockinchina.com

SOURCE: Lockin China

ReleaseID: 534100

Humidifiers Market 2018-2026 with data by product types, applications and regional analysis

The global humidifiers market is expected to witness a growth of 4.2% CAGR during the forecast period from 2018 to 2026.

SANJOSE, United States – January 31, 2019 /MarketersMedia/

According to a new market report published by Credence Research, Inc., “Global Humidifiers Market- Growth, Future Prospects and Competitive Landscape, 2018 – 2026”, the global humidifiers market is expected to witness a growth of 4.2% CAGR during the forecast period from 2018 to 2026.

Product Insights

The global humidifiers market was valued at US$ 2.03 Bn in 2017 and is likely to witness a steady growth, growing at a CAGR of 4.2% during the forecast period from 2018 to 2026. Humidifiers are mainly used to increase the humidity level of an entire building or a single room to provide healthy and comfortable environment to the occupants. Humidifiers are also used in reducing static electricity, which exemplifies the primary issue for computer storage devices, electronic devices, and compact discs. Growing consumer awareness about standardizing and maintaining the enhanced surrounding air quality for healthy atmosphere is likely to augment the growth of humidifiers market worldwide during the forecast period from 2018 to 2026.

Browse the full report at https://www.credenceresearch.com/report/humidifiers-market

Get Sample @ https://www.credenceresearch.com/sample-request/59554

The global humidifiers market, based on product type was dominated by the warm-mist humidifiers segment in 2017. The growth of this segment is mainly accredited to the bacteria free environment offered by these devices. Warm-mist humidifiers are intended for creating a warm moisture from heated water. As this type of humidifier functions with warm water instead of cold, it helps fighting off any bacteria that may grow in parts of the humidifier. Further, based on geography, North America led the humidifiers market in 2017. The growth of this region is mainly accredited to the growing awareness among consumers about the importance of maintaining adequate humidity levels. In addition, the presence of government organizations including United States Environmental Protection Agency (USEPA) and American Society of Heating, Refrigeration and Air-conditioning Engineers (ASHRAE) is increasing and promoting the awareness towards usage of humidifiers in the region

Competitive Insights:

Major players in the humidifiers market include BONECO AG, CAREL INDUSTRIES S.p.A., Armstrong International Inc., Carrier Corporation, DriSteem, Condair Group, Procter & Gamble, Honeywell International Inc., National Environmental Products Ltd., Koninklijke Philips N.V., Vornado Air, LLC, Stadler Form Aktiengesellschaft, Winix Inc., Crane, De’Longhi Appliances S.r.l., Dyson Ltd., Bryant Heating & Cooling Systems, LG Electronics, GE Appliances, and Heaven Fresh USA Inc. among others. The humidifiers manufacturers are adopting several strategies to thrive in the competitive environment. These players are increasingly focusing on differentiating their product offerings through clear and unique value propositions to succeed, survive and remain competitive with their counterparts. New product developments, partnerships remain the most significant strategies that are been adopted by the key players to gain an edge over others.

Product Type Segment (2016-2026; US$ Bn)
Warm-mist Humidifiers
Cool-mist Humidifiers
Ultrasonic Humidifiers
Evaporative Humidifiers

Size Segment (2016-2026; US$ Bn)
Central Humidifiers
Console Humidifiers
Portable Humidifiers

End-user Segment (2016 – 2026; US$ Bn)
Residential
Commercial
Industrial

ToC:

3. Market Dynamics
3.1. Introduction
3.1.1. Global Humidifiers Market Value, 2016 – 2026, (US$ Bn)
3.2. Market Dynamics
3.2.1. Market Drivers
3.2.2. Market Restraints
3.3. Attractive Investment Proposition, by Geography, 2017
3.4. Market Positioning of Key Players, 2017
3.4.1. Major Strategies Adopted by Key Players

4. Global Humidifiers Market, by Product Type , 2016 – 2026 (US$ Bn)
4.1. Overview
4.2. Warm-mist Humidifiers
4.3. Cool-mist Humidifiers
4.4. Ultrasonic Humidifiers
4.5. Evaporative Humidifiers

5. Global Humidifiers Market, by Size, 2016 – 2026 (US$ Bn)
5.1. Overview
5.2. Central Humidifiers
5.3. Console Humidifiers
5.4. Portable Humidifiers

6. Global Humidifiers Market, by End-user, 2016 – 2026 (US$ Bn)
6.1. Overview
6.2. Residential
6.3. Commercial
6.4. Industrial

7. North America Humidifiers Market Analysis, 2016 – 2026 (US$ Bn)
7.1. Overview
7.1.1. North America Humidifiers Market Value and Growth, 2016 – 2026, (US$ Bn)
7.2. North America Humidifiers Market Value, By Product Type, 2016 – 2026 (US$ Bn)
7.2.1. Market Analysis
7.3. North America Humidifiers Market Value, By Size, 2016 – 2026 (US$ Bn)
7.3.1. Market Analysis
7.4. North America Humidifiers Market Value, By End-user, 2016 – 2026 (US$ Bn)
7.4.1. Market Analysis
7.5. North America Humidifiers Market Value, By Region/Country, 2016 – 2026 (US$ Bn)
7.5.1. Market Analysis
7.5.2. U.S.
7.5.3. Rest of North America

8. Europe Humidifiers Market Analysis, 2016 – 2026 (US$ Bn)
8.1. Overview
8.1.1. Europe Humidifiers Market Value and Growth, 2016 – 2026, (US$ Bn)
8.2. Europe Humidifiers Market Value, By Product Type, 2016 – 2026 (US$ Bn)
8.2.1. Market Analysis
8.3. Europe Humidifiers Market Value, By Size, 2016 – 2026 (US$ Bn)
8.3.1. Market Analysis
8.4. Europe Humidifiers Market Value, By End-user, 2016 – 2026 (US$ Bn)
8.4.1. Market Analysis
8.5. Europe Humidifiers Market Value, By Region/Country, 2016 – 2026 (US$ Bn)
8.5.1. Market Analysis
8.5.2. U.K.
8.5.3. Germany
8.5.4. France
8.5.5. Rest of Europe
…………………………..

11. Company Profiles
11.1. BONECO AG
11.2. CAREL INDUSTRIES S.p.A.
11.3. Armstrong International Inc.
11.4. Carrier Corporation
11.5. DriSteem
11.6. Condair Group
11.7. Procter & Gamble
11.8. Honeywell International Inc.
11.9. National Environmental Products Ltd.
11.10. Koninklijke Philips N.V.
11.11. Vornado Air, LLC
11.12. Stadler Form Aktiengesellschaft
11.13. Winix Inc.
11.14. Crane
11.15. De’Longhi Appliances S.r.l
11.16. Dyson Ltd.
11.17. Bryant Heating & Cooling Systems
11.18. LG Electronics
11.19. GE Appliances
11.20. Heaven Fresh USA Inc.
…………………..toc continued

Browse the full report at https://www.credenceresearch.com/report/humidifiers-market

Get Sample @ https://www.credenceresearch.com/sample-request/59554

About Us
Credence Research is a worldwide market research and counseling firm that serves driving organizations, governments, non-legislative associations, and not-for-benefits. We offer our customers some assistance with making enduring enhancements to their execution and understand their most imperative objectives. Over almost a century, we’ve manufactured a firm extraordinarily prepared to this task.

Contact Info:
Name: Chris Smith
Email: Send Email
Organization: Credence Research
Address: 105 N 1st ST #429, SAN JOSE,, CA 95103, United States
Phone: 18003618290
Website: https://www.credenceresearch.com

Source URL: https://marketersmedia.com/humidifiers-market-2018-2026-with-data-by-product-types-applications-and-regional-analysis/477948

Source: MarketersMedia

Release ID: 477948

Global Homeland Security & Public Safety Market 8-Volume Mega-Report

Global Homeland Security & Public Safety Market – 2019-2024: 8-Volume Mega-Report provide market size and trends of 88 markets & 630 sub-markets during 2017-2024, Market drivers & inhibitors, SWOT analysis and recent annual revenues.

Pune, India – January 31, 2019 /MarketersMedia/

The global Public Safety & Homeland Security market is expected to grow from $431 Billion in 2018 to $606 Billion in 2024 at a CAGR of 5.8%.
The Global Homeland Security & Public Safety Market 2019-2024: 8-Volume Mega-Report contains a thorough analysis of 16 vertical markets, 24 technology markets, 5 regional markets and 43 national markets, detailing 630 relevant sub-market aspects in total.

This 2,420-page market report is the utmost comprehensive review of the global Homeland security & public safety market available today. The objective of this mega-report is to provide today’s strategic decision-makers with an expert 360-degree, time-sensitive, detailed view of this interconnected market.

17 years have passed since 9/11, and the global Public Safety & Homeland Security Market, technologies and industry are forecast to go through major shifts. New and maturing technologies, such as artificial intelligence, big data & data analysis, smart sensors, AI-based cybersecurity, 5G, TETRA & LTE emergency communication and AI based video analytics, will create new market segments and fresh business opportunities.

Market growth is driven by the following factors:
• Terror
• New and maturing technologies, (e.g., UGV, counter-drone systems, artificial intelligence, big data & data analysis, smart sensors, AI-based cybersecurity, 5G, TETRA & LTE emergency communication and AI based video analytics)
• President Trump’s national security & law enforcement agenda
• Organized crime
• PRC President Xi’s internal security policy
• Cybercrime and Cyberterrorism
• The turmoil in the Arab world – the ongoing conflicts in Iraq, Syria and Yemen, and the Shia-Sunni conflict
• An “invest whatever it takes” approach of autocratic and semi-autocratic governments (e.g., Saudi-Arabia, Iran, Egypt, Russia, Turkey) to avoid regime change
• High security spending by governments (e.g., Israel, Brazil, Nigeria) exposed to high risk of terror and/or crime
• Climate warming-related natural disasters growth

The Asian-Pacific & North American markets will continue to dominate the market, holding together over 50% of market share during the forecast period. Market analyses by country show that Saudi Arabia, UAE, the U.S.A and Israel are the leading markets in terms of market size per citizen.

Get Discount on this Research Report at https://www.reportsnreports.com/contacts/discount.aspx?name=1891146

Why Buy this Report?
A. Questions answered in the 88 market reports include:
• What is the market size and what are the trends of 88 markets & 630 sub-markets during 2017-2024?
• What are the submarkets that provide attractive business opportunities?
• Who are the decision-makers?
• What drives the customers to purchase security solutions and services?
• What are the customers looking for?
• What are the internal security technology & services trends?
• What are the 88 markets SWOTs (Strengths, Weaknesses, Opportunities and Threats)?
• What are the challenges to market penetration & growth?

B. The Global Homeland Security & Public Safety Market size data is analyzed via 6 independent key perspectives.
With a highly fragmented market we address the “money trail” – each dollar spent, and the Global Homeland Security & Public Safety budget is analyzed and crosschecked via 6 orthogonal viewpoints:
• By 24 Technology Market Reports Summaries:
• Automatic Border Control (ABC)
• Big Data for HLS and public safety
• Bio-Agents & Infectious Disease Mitigation
• Biometrics
• Border & Perimeter Barriers
• C2/C4ISR Systems
• Chemical, Hazmat & Nuclear Detection
• Counter-IED Technologies
• Cybersecurity
• Decontamination of CBRN & Hazmat Incidents
• Electronic Fencing
• Emergency Communication
• Explosives Trace Detection (ETD)
• Information Technologies (w/o Intel & Cyber)
• Intelligence Services IT
• Intrusion Detection Systems
• Metal Detectors
• Non-Lethal Weapons
• Personal (Ballistic & CBRNE) Protective Gear
• Standoff Explosives & Weapon Detection
• Tomographic Explosive Detection Systems & BHS
• Video Analytics
• Video Surveillance (w/o Analytics)
• X-Ray Screening

By 16 Vertical Market Reports Summaries:
• Aviation Security
• Border Security
• CBRN Security & Safety
• Critical Infrastructure Protection
• Diplomatic Corp. Security
• Immigration Enforcement
• Intelligence Agencies
• Maritime Security
• Mass Transportation Security
• Natural Disasters Mitigation
• Perimeter Security (w/o CIP)
• Police Modernization & Other 1st Responders
• Private Sector Security (w/o CIP)
• Public Events Security
• Safe City
• Other Vertical Markets

By 43 National Markets:
By 5 Regional Market Reports Summaries
• North America
• Latin America
• Europe
• Middle East & Africa
• Asia Pacific

By 5 Revenue Source Markets:
• Product Sales
• Integration & Installation
• Outsources Services
• Planning & Consulting
• Maintenance & Upgrades

By 10 Expenditure Markets:
• Pre-purchase Consulting
• Outsourced Planning
• Software Based Products
• Hardware Based Products
• Installation
• Integration & Commissioning
• Post-Warranty Maintenance
• Upgrades & Consumables
• Outsourced Training
• Other Expenditures

C. Detailed market analysis frameworks for each of the market sectors are provided, including:
• Market drivers & inhibitors
• Business opportunities
• SWOT analysis
• Competitive analysis
• Business environment
• The 2017-2024 market

D. The Homeland Market report includes the following 5 appendices:
• Appendix A: National Homeland Security & Public Safety Market Background for 43 countries
• Appendix B: Emerging Threats Facing the EU & USA
• Appendix C: Homeland Security & Public Safety Industry
• Appendix D: Homeland Security & Public Safety Related Products Standards
• Appendix E: Abbreviations

Direct Purchase of this Research Report at https://www.reportsnreports.com/purchase.aspx?name=1891146

E. The Market Analysis addresses over 320 global homeland security and public safety standards (including links).

F. The report provides updated extensive data of 118 leading homeland security and public safety vendors (including companies’ profile, recent annual revenues, key executives, homeland security and public safety products, and contact info.):
• 3M
• 3i-MIND
• 3VR
• 3xLOGIC
• ABB
• Accenture
• ACTi Corporation
• ADT Security Services
• AeroVironment Inc.
• Agent Video Intelligence
• Airbus Defence and Space
• Alcatel-Lucent (Nokia Group)
• ALPHAOPEN
• Anixter
• Aralia Systems
• AT&T Inc.
• Augusta Systems
• Austal
• Avigilon Corporation
• Aware
• Axis
• AxxonSoft
• Ayonix
• BAE Systems
• BioEnable Technologies Pvt Ltd
• BioLink Solutions
• Boeing
• Bollinger Shipyards, Inc
• Bosch Security Systems
• Bruker Corporation
• BT
• Camero
• Cassidian
• CelPlan
• China Security & Surveillance, Inc.
• Cisco Systems
• Citilog
• Cognitec Systems GmbH
• Computer Network Limited (CNL)
• Computer Sciences Corporation
• CrossMatch
• Diebold
• DRS Technologies Inc.
• DVTel
• Elbit Systems Ltd.
• Elsag Datamat
• Emerson Electric
• Ericsson
• ESRI
• FaceFirst
• Finmeccanica SpA
• Firetide
• Fulcrum Biometrics LLC
• G4S
• General Atomics Aeronautical Systems Inc.
• General Dynamics Corporation
• Getac Technology Corporation
• Hanwha Techwin
• Harris Corporation
• Hewlett Packard Enterprise
• Hexagon AB
• Honeywell International Inc.
• Huawei Technologies Co., Ltd
• IBM
• IndigoVision
• Intel Security
• IntuVision Inc
• iOmniscient
• IPConfigure
• IPS Intelligent Video Analytics
• Iris ID Systems, Inc.
• IriTech Inc.
• Israel Aerospace Industries Ltd.
• ISS
• L-3 Security & Detection Systems
• Leidos, Inc.
• Lockheed Martin Corporation
• MACROSCOP
• MDS
• Mer group
• Milestone Systems A/S
• Mirasys
• Motorola Solutions, Inc.
• National Instruments
• NEC Corporation
• NICE Systems
• Northrop Grumman Corporation
• Nuance Communications, Inc.
• ObjectVideo
• Panasonic Corporation
• Pelco
• Pivot3
• Proximex
• QinetiQ Limited
• Rapiscan Systems, Inc.
• Raytheon
• Rockwell Collins, Inc.
• Safran S.A.
• Salient Sciences
• Schneider Electric
• SeeTec
• Siemens
• Smart China (Holdings) Limited
• Smiths Detection Inc.
• Sony Corp.
• Speech Technology Center
• Suprema Inc.
• Synectics Plc
• Tandu Technologies & Security Systems Ltd
• Texas Instruments
• Textron Inc.
• Thales Group
• Total Recall
• Unisys Corporation
• Verint
• Vialogy LLC
• Vigilant Technology
• Zhejiang Dahua Technology

Contact Info:
Name: Vishal Kalra
Email: Send Email
Organization: ReportsnReports
Website: https://www.reportsnreports.com/reports/1891146-global-homeland-security-public-safety-market-2019-2024-8-volume-mega-report.html

Source URL: https://marketersmedia.com/global-homeland-security-public-safety-market-8-volume-mega-report/477950

Source: MarketersMedia

Release ID: 477950

Thermoformed Containers Market Volume Sales will Grow at 3.7% in 2019

Future Market Insights has announced the addition of the “Thermoformed Containers Market: Food & Beverage Segment Expected to Witness Significant Growth in Sales with Introduction of Innovative Clamshell Packaging Formats: Global Industry Analysis 2013 – 2018 and Opportunity Assessment 2019 – 2027″ report to their offering.

Valley Cottage, United States – January 31, 2019 /MarketersMedia/

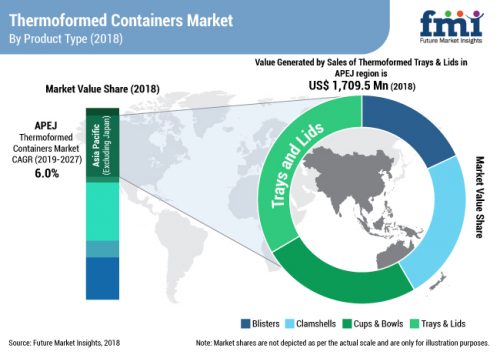
Thermoformed container sales surpassed 185 billion units in 2018, equaling a market value worth US$ 15.9 billion. FMI’s new study forecasts that the thermoformed containers market volume sales will grow at 3.7% in 2019. The projected growth of the thermoformed containers market can be attributed to,

An extensive penetration of thermoforming material in daily applications

Developments in thermoforming container manufacturing technology, particularly the implementation of 3D printing tools

Initiatives of manufacturers as well as national governments towards recycling of thermoforming materials

Introduction of easily recyclable, more effective and application-specific thermoforming containers

Request Report Sample@ https://www.futuremarketinsights.com/reports/sample/rep-gb-8606

“As an efficient, durable and safer mode of packaging, thermoformed containers have penetrated in a wide range of applications ranging from consumer goods to medical packaging. With the advent of 3D printing tools, manufacturing capacities of thermoforming are set to expand in the future. And on the back of increased efforts in recycling, thermoformed containers are likely to observe steady growth prospects in the coming years wherein volume sales are expected to reach 191 billion units in 2019, totaling revenues worth US$ 16.6 billion,” says FMI.

Thermoformed Trays and Lids Segment Lucrative, Blisters are Top Selling

The study finds that trays and lids continue to garner greater revenues while blisters remain top-selling product and held one-third of the global sales in 2018. Thermoformed trays and lids accounted for over one-fifth of the sales and remained the most lucrative segment.

Increased use of blister packaging has led manufacturers to introduce various innovations in the form of enhanced protective features, production and technology integration and sustainability. In particular, pharmaceutical packaging manufacturers are leveraging these innovations in the blister packaging to meet the evolving expectations of stakeholders while maintaining a good profit margin.

Thermoformed trays and lids are highly embraced by end-users owing to their versatility in design manufacturing and customization for brand marketing. Also, efficient sealable feature combined with effective resealing extends the application scope of thermoformed trays and lids across end-user industries ranging from food to pharma.

Over 3 in 10 Thermoformed Containers Sold in 2018 were of Polyenthylene

The study finds that polyethylene thermoformed containers accounted for over one-third volume sold in 2018. Polypropylene remains the second most preferred material and accounted for over one-fifth share of the total thermoformed containers sold in 2018.

Polyethylene fits well in the packaging industry’s trending material features such as light-weight and strength. High density polyethylene (HDPE) is one of the highly dependable material among different polymers used across thermoforming container applications. Along with rigidity, polyethylene provides resistance to stains, odors and moisture- characteristics that are highly embraced across industrial applications.

Well aware of polyethylene’s popularity, manufacturers provide a number of options with respect to shape, color, size and thickness, implying its widespread adoption.

4 in 10 Thermoformed Containers Sold to Food and Beverage Industry in 2018

The study reveals that the food and beverage industry continues to register increasing demand for thermoformed containers and accounted for 40% sales in 2018. Growing demand for canned and packaged food on the back of changing lifestyles and urbanization is contributing to the sales of thermoformed containers in the food and beverage industry. A trend of ready-to-eat food and a growing emphasis on hygienic packaging further increases demand for thermoformed containers in the F&B sector.

Sales in the pharmaceutical industry remained the second largest, accounting for 3 in 10 thermoformed containers’ sales in 2018. Blisters are the highly embraced packaging products, especially for medicines whose sales have increased exponentially over the past few years.

Request to Browse Report Customization@ https://www.futuremarketinsights.com/customization-available/rep-gb-8606

Thermoformed Containers Sales Spearheaded by APEJ

The FMI study opines that APEJ spearheads the thermoformed container consumption. In 2018, the region accounted for over one-third of the global volume sales with China at the helm of thermoformed container sales in APEJ. The region presents lucrative opportunities for manufacturers with the availability of raw materials, low-cost labor and significant demand for thermoformed packaging from end-use applications. Also, investments in food and beverage as well as pharmaceutical packaging is increasing with the expanding middle class and improving economic scenario.

The FMI report tracks the thermoformed containers market for the period 2019-2027. According to the report, the thermoformed containers market is projected to grow at 4% volume CAGR through 2027.

More from Packaging Market:

Smart Labels Market Analysis

Blow Fill Seal Technology Market Analysis

Aluminium Extrusions Market Analysis

Contact Info:
Name: Abhishek Budholiya
Organization: Future Market Insights
Address: 616 Corporate Way,, Suite 2-9018,, Valley Cottage,
Phone: 3479183531
Website: https://www.futuremarketinsights.com/reports/thermoformed-containers-market

Source URL: https://marketersmedia.com/thermoformed-containers-market-volume-sales-will-grow-at-37-in-2019/477952

Source: MarketersMedia

Release ID: 477952

Valacyclovir HCl Market 2019: Potential growth, attractive valuation make it is a long-term investment

Valacyclovir HCl Market: The report shows basic overview of the industry including its definition, applications and manufacturing technology. And the report includes different business profiles with Product Information and Contact Information.

DUBLIN, United States – January 31, 2019 /MarketersMedia/

Global Valacyclovir HCl Market report shows the Industry Chain Structure as well as Macroeconomic Environment Analysis and Development Trend. This report contains global forecast till 2023 with more than 10 major players and there detailed information (Name, Company Profile, Product Information etc.). The total market is further divided by company, by country, and by application/types for the competitive landscape analysis. The report then estimates 2018-2023 market development trends of Valacyclovir HCl Industry.

Get a Sample copy of this report at
https://www.inforgrowth.com/samplerequest/r/844124/global-and-southeast-asia-valacyclovir-hcl-ind

Global Valacyclovir HCl Market report describes the development of the industry by upstream & downstream, industry overall and development, key companies, as well as type segment & market application and so on, and makes a scientific prediction for the development industry prospects on the basis of analysis, finally, analyzes opportunities for investment in the industry at the end of the report. Through the statistical analysis, the report depicts the global and Southeast Asia total market of Valacyclovir HCl Market including capacity, production, production value, cost/profit, supply/demand and Southeast Asia import/export.

The Valacyclovir HCl report provides a basic overview of the industry including its definition, applications and manufacturing technology. Then, the report explores the international and Southeast Asia major industry players in detail. In this part, the report presents the company profile, product specifications, capacity, production value, and 2013-2018 market shares for each company.

For competitor segment, the report includes global key players of Valacyclovir HCl Market as well as some small players. The information for each competitor includes:

Company Profile
Main Business Information
SWOT Analysis
Sales, Revenue, Price and Gross Margin
Market Share

Get Exclusive Discount Up To 50% on this Report: https://www.inforgrowth.com/requestdiscount/r/844124/global-and-southeast-asia-valacyclovir-hcl-ind

The Valacyclovir HCl Market Report analysis by primary as well as secondary analysis.

The Valacyclovir HCl Market report providing comprehensive syndicated market research reports with in-depth analysis of global trending markets and global sectors. The research experts use exclusive mixture of primary and secondary research, different analytics, and industry research to give a holistic view of the Valacyclovir HCl market and business ecosystem.

The Valacyclovir HCl Market Research Report consists of the following points:

An overall outlook of the Valacyclovir HCl Market that helps in picking up the essential data about the market.
The Valacyclovir HCl Market has been segmented on the basis of the product types, applications, end-users, as well as the industry verticals, in light of numerous factors.
The Valacyclovir HCl Market report also includes the study of the latest developments and the profiles of key industry players.
The Valacyclovir HCl Market research report also presents an eight-year forecast on the basis of how the market is predicted to grow.

View Complete Report having 143 Pages with TOC:
https://www.inforgrowth.com/r/844124/global-and-southeast-asia-valacyclovir-hcl-ind

Contact Info:
Name: Rohan
Email: Send Email
Organization: InForGrowth
Address: 6400 Village Pkwy suite # 104, Dublin, CA 94568, USA
Phone: +1-909-329-2808
Website: https://www.inforgrowth.com/

Source URL: https://marketersmedia.com/valacyclovir-hcl-market-2019-potential-growth-attractive-valuation-make-it-is-a-long-term-investment/477954

Source: MarketersMedia

Release ID: 477954

Chemotherapy-induced Myelosuppression Treatment Market to Grow at 3% in 2019: FMI Study

Future Market Insights has announced the addition of the “Chemotherapy-Induced Myelosuppression Treatment Market: Increasing Prescription of Chemo-Adjuvant Therapy for Cancer Management to Boost Growth: Global Industry Analysis 2013-2017 and Opportunity Assessment 2018-2028″ report to their offering.

Valley Cottage, United States – January 31, 2019 /MarketersMedia/

A new study by FMI reveals that the chemotherapy-induced myelosuppression treatment market is expected to grow at a subdued 3% y-o-y in 2019. Valued at nearly US$ 7 billion in 2018, gains are likely to be driven by a combination of multipronged factors, including,

Development of natural product interventions for chemotherapy-induced side effects

Growing implementation of radiation treatment in cancer treatment owing to the associated high success rate of chemotherapy

Growing R&D investments in cancer research

The FMI study finds that ‘growth factor’ drugs continued to garner highest revenues in the chemotherapy-induced myelosuppression treatment market. In 2018, over 73% of the chemotherapy-induced myelosuppression treatment market revenues were consolidated in the growth factors. Gains were especially notable for granulocyte-colony stimulating factor or G-CSF, which accounted for over 60% of the global chemotherapy-induced myelosuppression treatment market revenues in 2018.

Request Report Sample@ https://www.futuremarketinsights.com/reports/sample/rep-gb-1364

The FMI study reveals that erythropoietin-stimulating agents (ESA) also accounted for a significant market share, with revenues likely to grow at 2.8% in 2019. In April 2017, FDA announced the removal of risk evaluation and mitigation strategy (REMS) requirement for the use of ESA drugs in myelosuppression treatment. The ESAs used in the treatment of radiation-induced myelosuppression treatment are epoetin alfa and darbepoetin alfa. This has led healthcare professionals to engage in the practice of discussing benefits as well as risks of treatments that include ESAs before initiating the use.

Hematopoietic growth factors have transformed the practice of cancer treatment by allowing stimulation of production of specific cells. With this, use of thrombopoietin receptor agonists is expected to rise rapidly at the rate of 3.5% in 2019.

Injectable Drugs Present Higher Therapeutic Availability over Orals

The FMI study finds that injectable drugs accounted for over 97% of the chemotherapy-induced myelosuppression treatment market revenues in 2018. The status-quo will continue in the future, however, the oral route of administration is expected to garner increasing annual revenues and expected to grow at 4.8% in 2019 over 2018.

Increasing number of research validations related to the benefits of the oral route of administration can be attributed to the higher growth rate of the segment in the future. However, revenues from the injectable route of the administration continue to grow steadily on the back of their higher therapeutic availability over orally administered drugs.

Market Revenues Consolidated in Neutropenia Treatment

According to the study, chemotherapy-induced myelosuppression treatment market revenues heavily consolidated in the neutropenia treatment. In 2018, neutropenia indication accounted for over 62% of market revenues. As neutropenia is one of the most common side effects of chemotherapy wherein prolongation of the same can lead to life-threatening infections. Owing to the severity of the implications, chemotherapy-induced myelosuppression therapeutics are heavily used in the treatment of neutropenia.

Anemia and thrombocytopenia indications also utilize chemotherapy-induced myelosuppression treatment therapeutics. The study finds that revenues in the thrombocytopenia treatment will grow at 3.7% y-o-y in 2019.

Retail Pharmacies Most Prominent Sales Channel

The study opines that chemotherapy-induced myelosuppression treatment therapeutics sales remain higher through retail pharmacies. Suppliers of these therapeutics have extensive distribution network with international retail pharmacies. Due to this, retail pharmacies accounted for over 48% of the chemotherapy-induced myelosuppression treatment market revenues in 2018.

Owing to heavy integration of pharmacies in the hospitals, distribution of chemotherapy-induced myelosuppression treatment therapeutics through hospital pharmacies also account for a considerable share of the market revenues. The study finds that hospital pharmacies can be called the second largest distributor of chemotherapy-induced myelosuppression treatment therapeutics owing to their 45% of the market revenues.

Request Methodology of this Report @ https://www.futuremarketinsights.com/askus/rep-gb-1364

US – The World’s Largest Chemotherapy-induced Myelosupression Treatment Market

FMI reveals that North America accounted for over 82% of the revenues in chemotherapy-induced myelosuppression treatment market in 2018. Presence of leading cancer therapeutics providers, significant R&D investments and established healthcare sector contribute to the bulk of market revenues. The U.S. remains the largest consumer of the chemotherapy-induced myelosuppression treatment market.

Market revenues in the APEJ region are likely to grow at higher rate owing to improving healthcare facility and growing penetration of advanced cancer care treatments. China, followed by India, accounts for the highest market revenues in APEJ owing to improving economic scenario and developing healthcare infrastructure.

The FMI report analyses chemotherapy-induced myelosuppression treatment market for the forecast period 2018-2028. As per the report, the chemotherapy-induced myelosuppression treatment market is estimated to grow at 3.2% CAGR through 2028.

More from Healthcare, Pharmaceuticals and Medical devices Market:

Micro Hospitals Market Analysis

Radioimmunotherapy Treatment Market Analysis

General Anesthesia Drugs Market Analysis

Contact Info:
Name: Abhishek Budholiya
Organization: Future Market Insights
Address: 616 Corporate Way,, Suite 2-9018,, Valley Cottage,
Phone: 3479183531
Website: https://www.futuremarketinsights.com/reports/chemotherapy-induced-myelosuppression-treatment-market

Source URL: https://marketersmedia.com/chemotherapy-induced-myelosuppression-treatment-market-to-grow-at-3-in-2019-fmi-study/477958

Source: MarketersMedia

Release ID: 477958